The so-called blast-furnace diagram describes which phases are stable in the different regions of the blast furnace, depending on the conditions of temperature and of the atmosphere inside the furnace[1]. It is basically a phase diagram, where the volume fraction of CO is represented on the X-axis and the temperature is represented on the Y-axis, which can easily be obtained by using the Phase Diagram module of FactSage. This diagram is also called Baur-Glässner Diagram, being a basic diagram in the theory of the blast furnace and having helped a lot in its further development and optimization in the last decades[1,2].
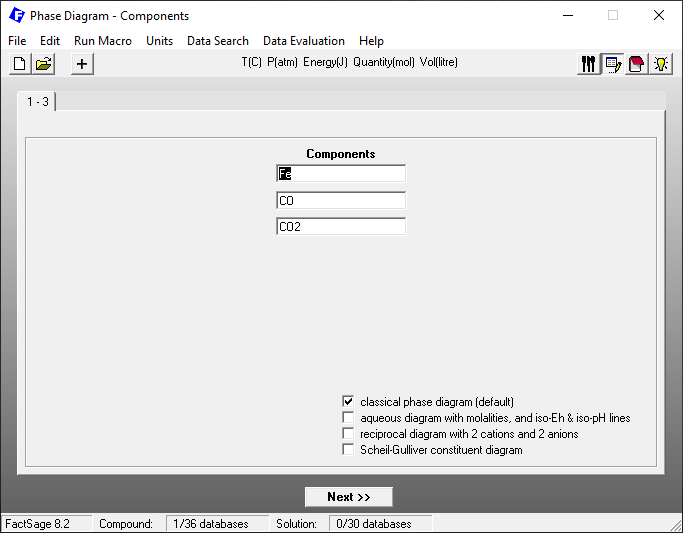
After starting the Phase Diagram module, one enters the components on the components window as depicted on Figure 1.
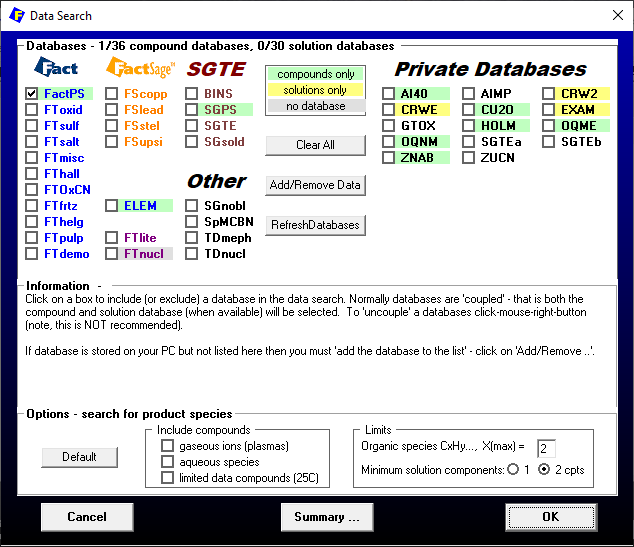
After selecting “Data Search” on the main menu, we then select for the simple example considered here only FactPS as a thermochemical database (Figure 2).
After clicking on “next”, we select the variables temperature and system compositions on the Menu window as depicted on Figure 3.
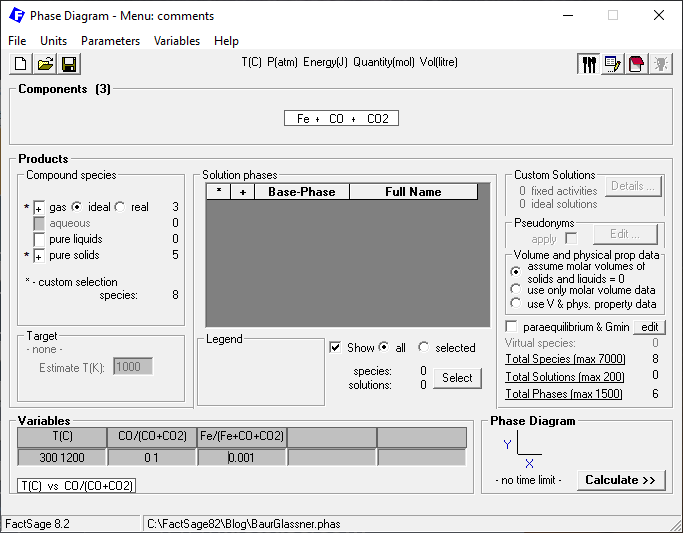
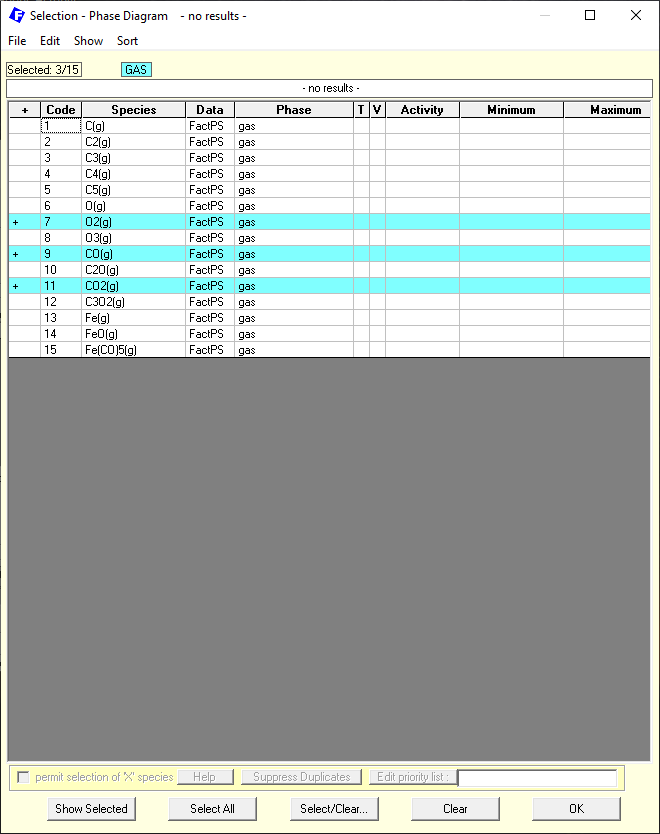
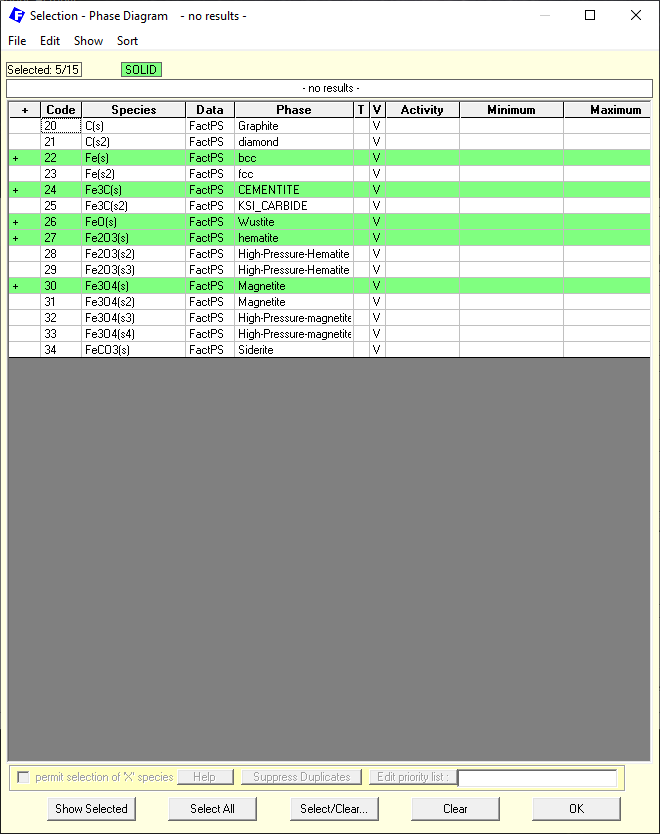
Notice that we do not select all possible species in the gas phase or all the possible solid compounds, as indicated in Figures 4 and Figure 5. We restrict the phase selection, so as to take into account only the stoichiometric compounds and gas species originally foreseen for the Baur-Glässner diagram, as it takes only stoichiometric reactions into account. Notice also that we fix the amount of iron at a small mole fraction, X(Fe) = 0.001.
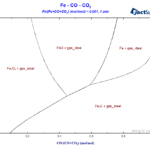
By clicking on calculate, we then generate the diagram, as shown in Figure 6.
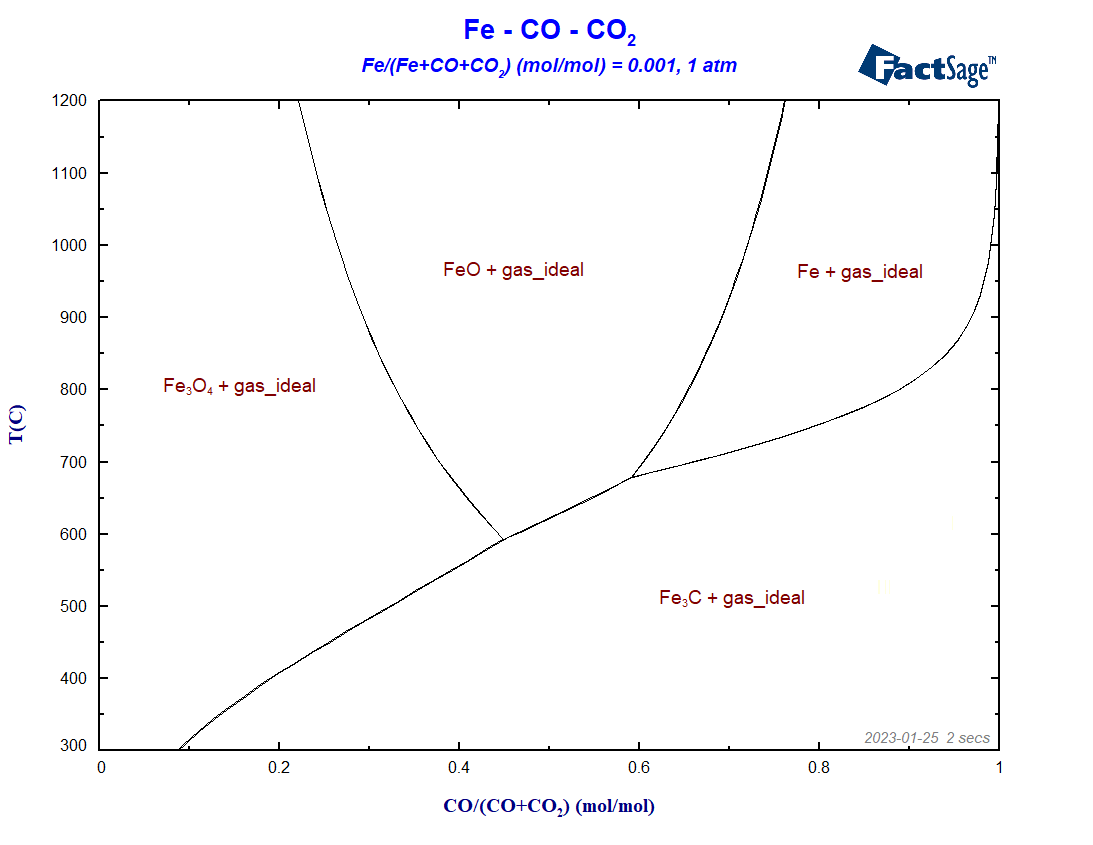
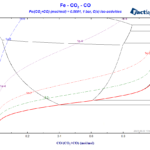
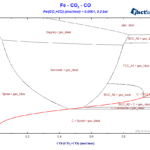
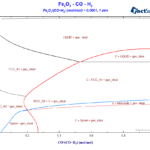
The diagram shows its charateristic fork-shaped lines, separating the regions where metallic iron, cementite, hematite and magnetite are stable. We fixed X(Fe) = 0.001 to get a sharp transition between the different regions. If we increase the value of X(Fe), the transition between the different iron compounds transforms: what were 3-phase lines before will become 3-phase areas, as one can notice in the ternary phase region “Fe+FeO+gas” in Figure 7 below.
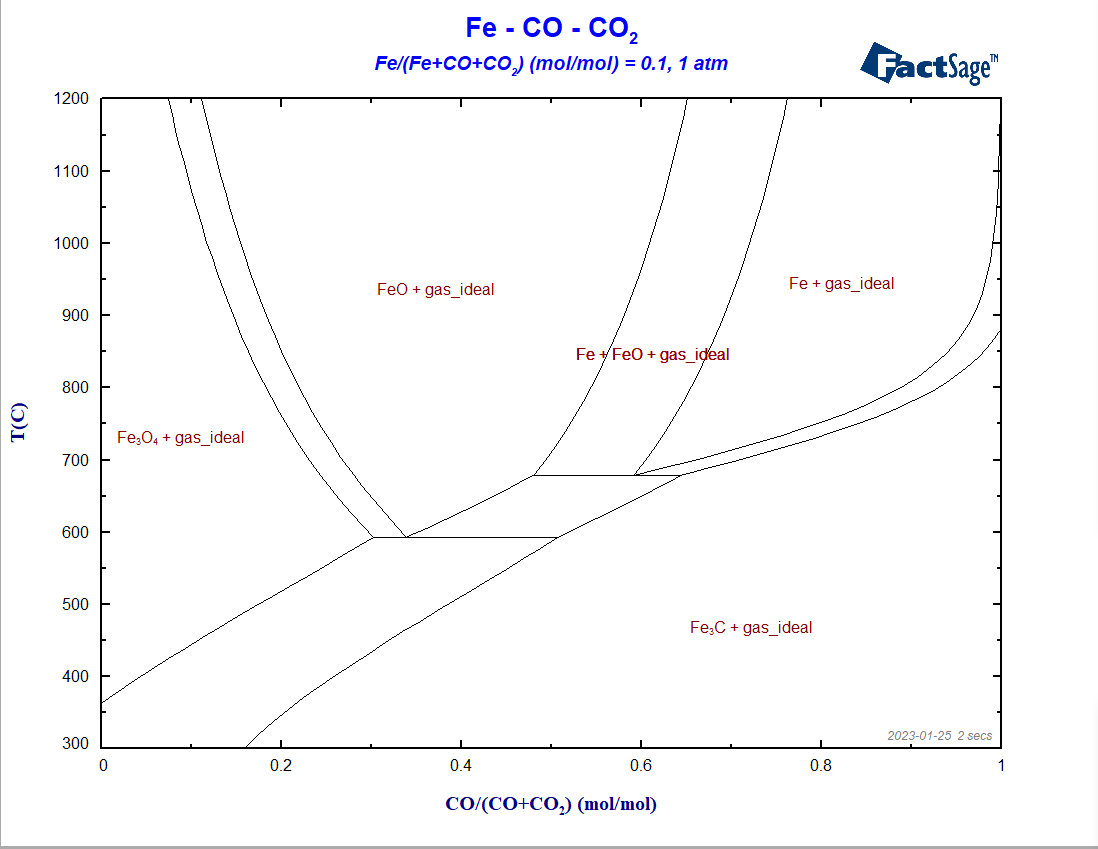
The diagram (Figure 7) is a typical Type II phase diagram[3]. Notice that in some regions the lines meet each other in a topology which resembles a classic eutectic/eutectoid reaction.
It is possible to think of many modifications for this diagram. What if carbon is not the reducing agent but hydrogen? What if we consider not only stoichiometric compounds but solution phases instead? This will be a topic for a future blog post… see you!
References
[1] Rosenqvist T (1983) Principles of Extractive Metallurgy. McGraw-Hill, Tokyo.
[2] Babich A, Senk D, Gudenau HW, Mavrommatis KT (2008) Ironmaking. Mainz Verlag, Aachen.
[3] Pelton AD, Schmalzried H (1973) On the Geometrical Representation of Phase Equilibria, Metallurgical Transactions 4: 1395-1404.
This post is part of our series Constructing a Blast Furnace Diagram with FactSage: