FactSageEdu

From molar Gibbs energy functions to phase diagrams – Part II

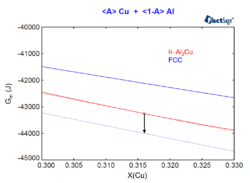
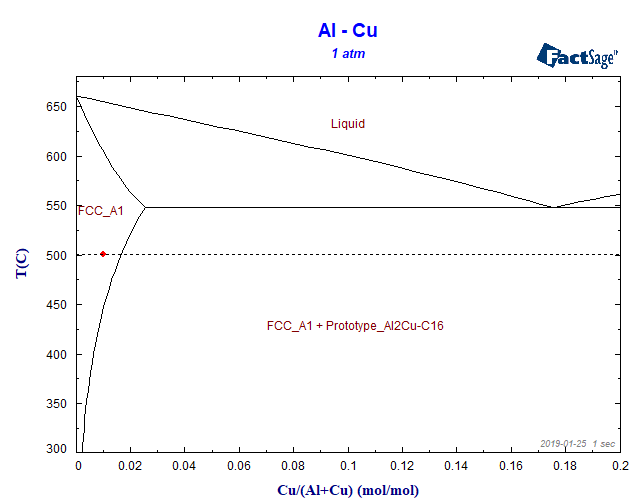
In this blog post we will see how to interpret the phase activity of a phase which does not form in equilibrium for a given temperature and pressure. For this, we will consider an Al-Cu alloy containing 0.01 mol% Cu at a temperature of 500°C and at a pressure of 1 atm and we will …

From molar Gibbs energy functions to phase diagrams – Part II Read More »

From molar Gibbs energy functions to phase diagrams

Al Cu Phase Diagram

In a series of posts, we will focus on the relation between phase diagrams, Gibbs energy functions and activities. Let us begin with the Al-Cu phase diagram at a temperature of 500 °C. In this blog post we will work exclusively with the FactSage Education Package. Let us suppose we have generated an Al-Cu phase-diagram …

From molar Gibbs energy functions to phase diagrams Read More »