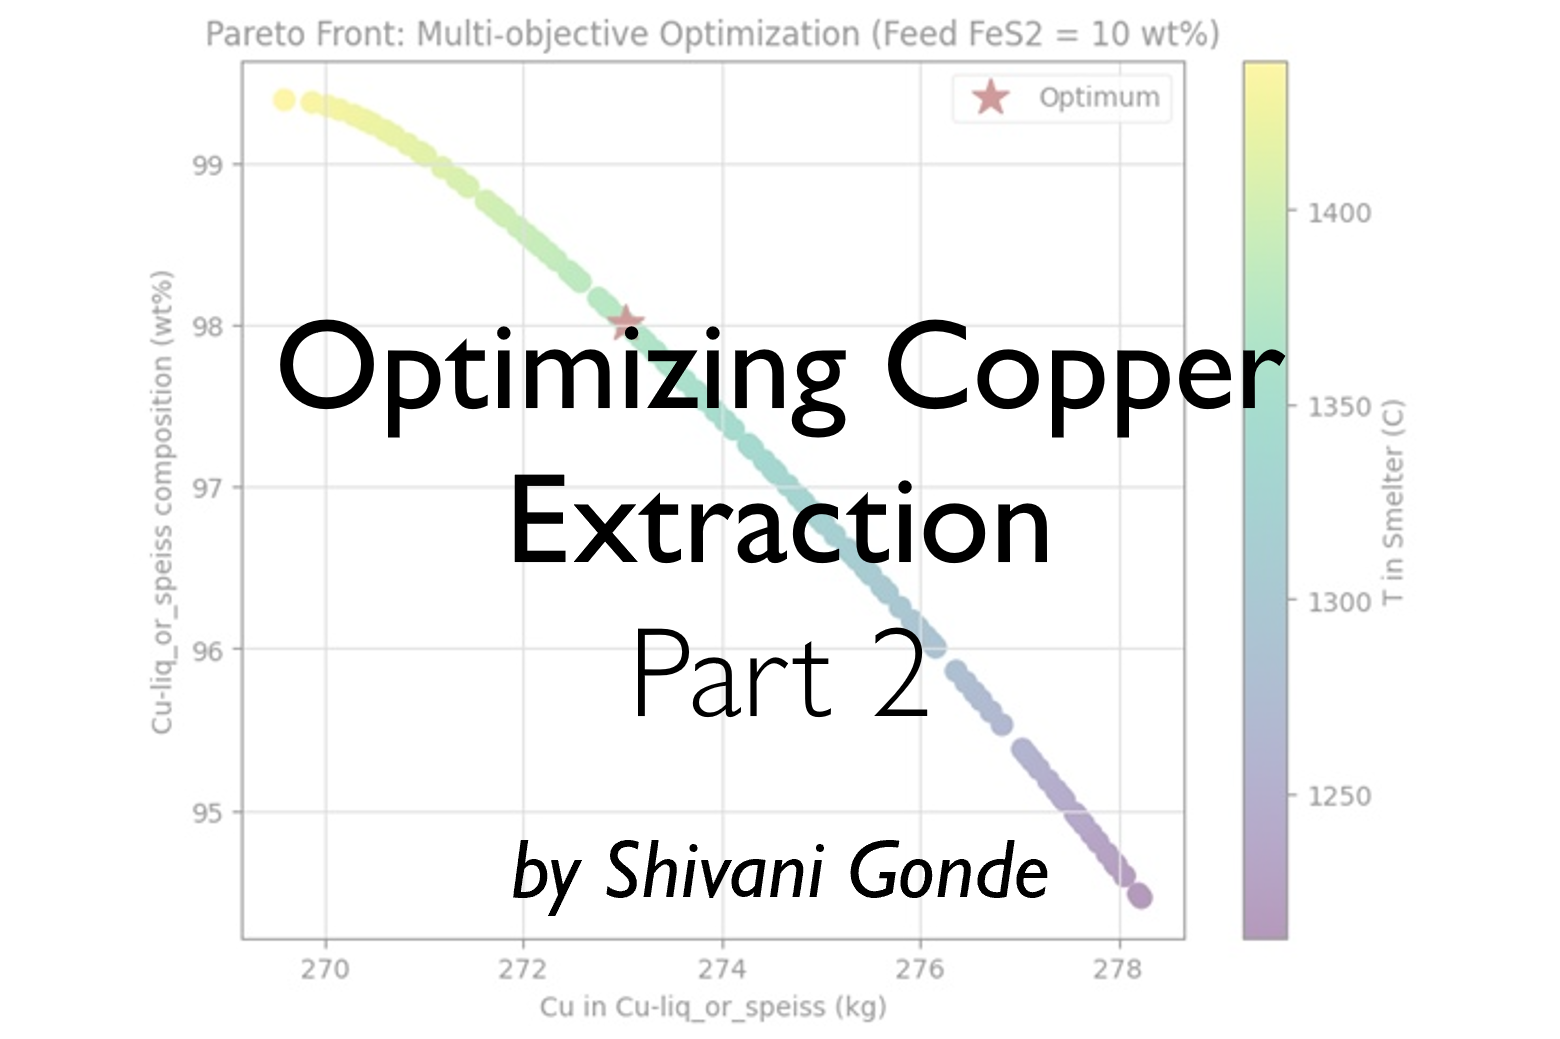
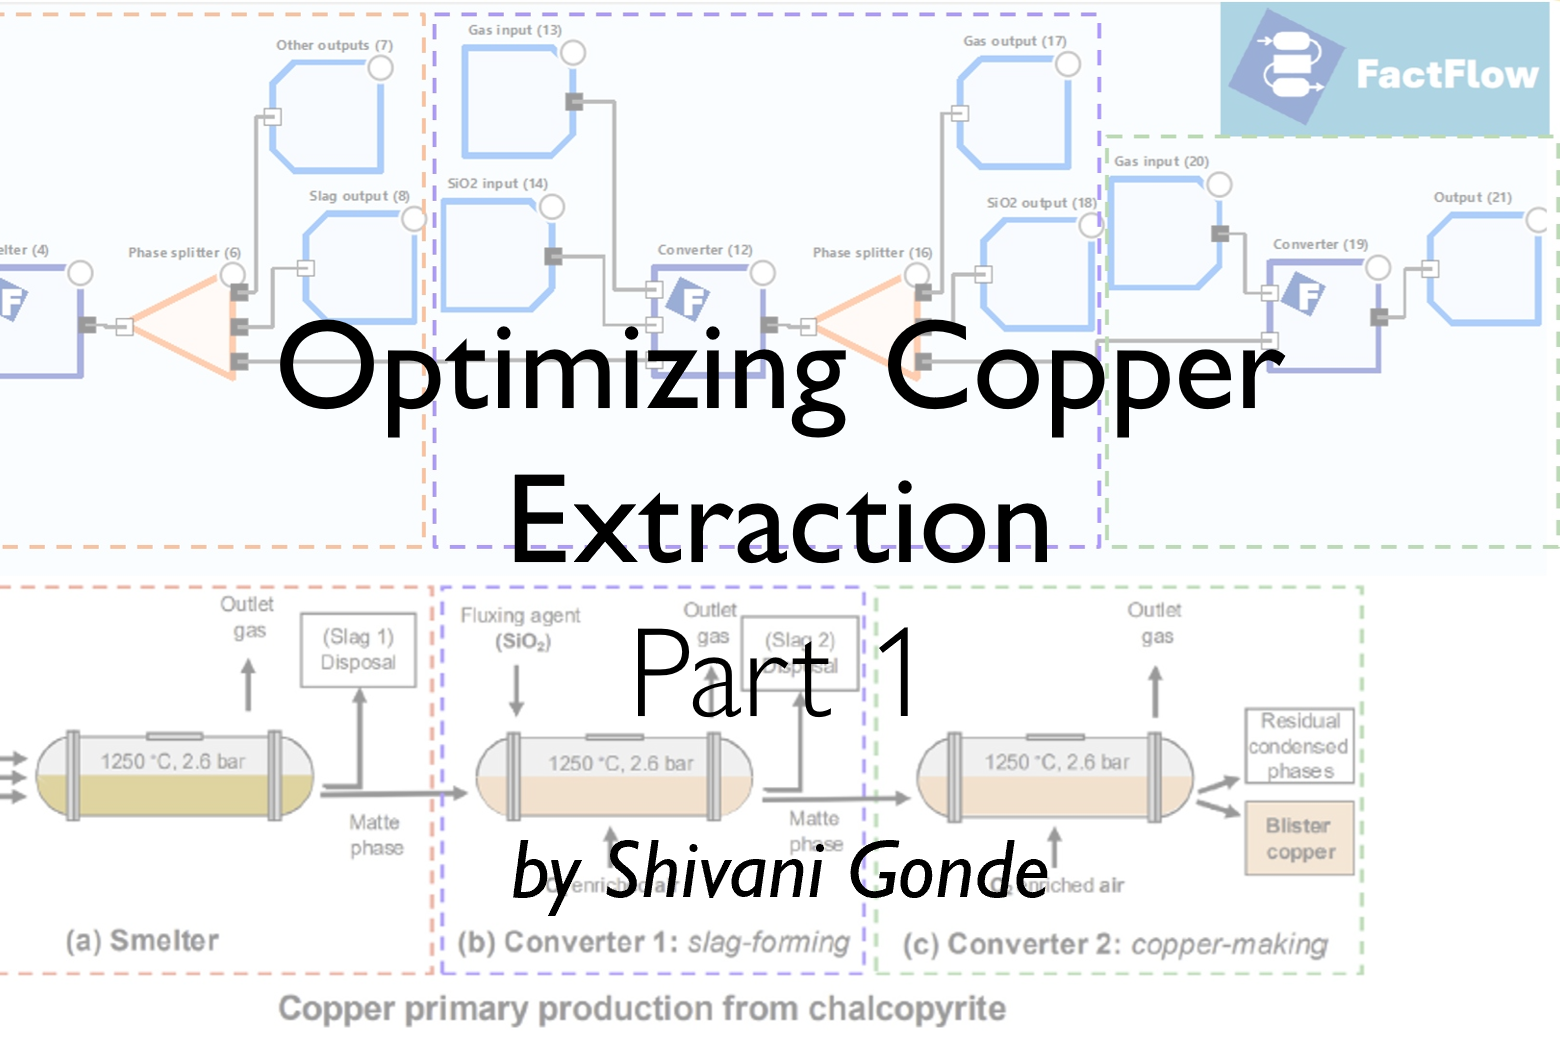
SysCAD + ChemApp for Copper Smelting: A Step-by-Step Guide to Building an Integrated Pyrometallurgical Flowsheet – Part I
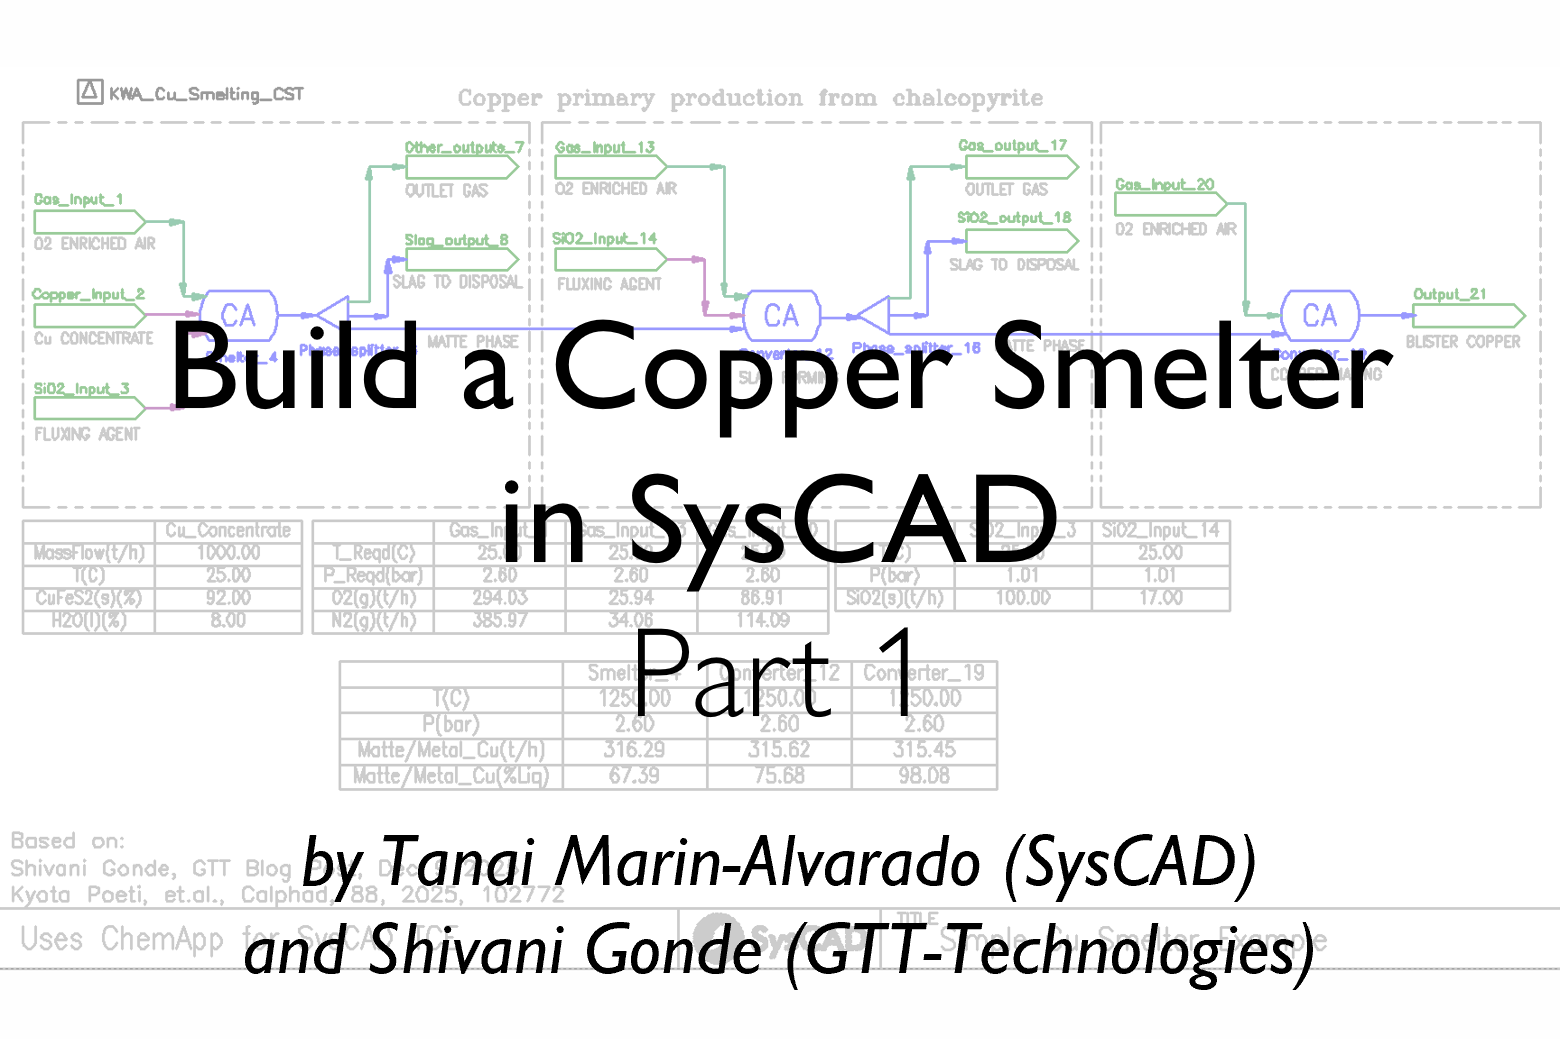
Following the ChemApp for Python workflow presented by Shivani Gonde (Part I, GTT-Technologies, December 2025) and the corresponding FactFlow implementation by Kyota Poeti et al. (CALPHAD 88, 2025, 102772), this post demonstrates how the same integrated copper smelting process can be implemented entirely within SysCAD. Using the ChemApp for SysCAD Thermodynamic Calculation Engine (TCE) Add-on, […]