In order to reduce the CO2 emissions caused by the iron & steel industry, there have been initiatives in the last decades to substitute reductants based on carbon by the use of H2 as a reducing agent. These initiatives go from the direct injection of H2 at the tuyeres of the blast furnace [1, 2] to alternative processes that employ the so-called direct reduction [3], whereby the reduction of the iron ore to metallic iron occurs without melt formation. In those processes, reduction is achieved by using a H2– or a (CO+H2)-rich gas, typical examples for these processes are the Midrex [3] and the Circored [4] processes.
In this blog post, we will show how the blast furnace diagram looks like when H2 is used as a reducing agent. This blog post was written in collaboration with Klaus Hack.
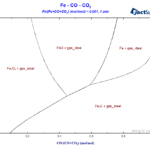
At first, let us draw a similar diagram to the one of the last blog post but now using Fe, H2 and H2O as components instead of Fe, CO and CO2. We will not show details of the set-up, we will just pinpoint the differences between the two set-ups. The calculation is based on the same set of databases as before, i.e. FactPS, FToxid and FSstel. Only the gaseous species of FactPS are selected and all the solution phases available by default in FToxid and in FSstel are also selected. No condensed compound species need to be selected in this case. In the present case, we set the value of the molar ratio Fe/(H2+H2O) to 0.0001. The resultant diagram in shown on Figure 1.
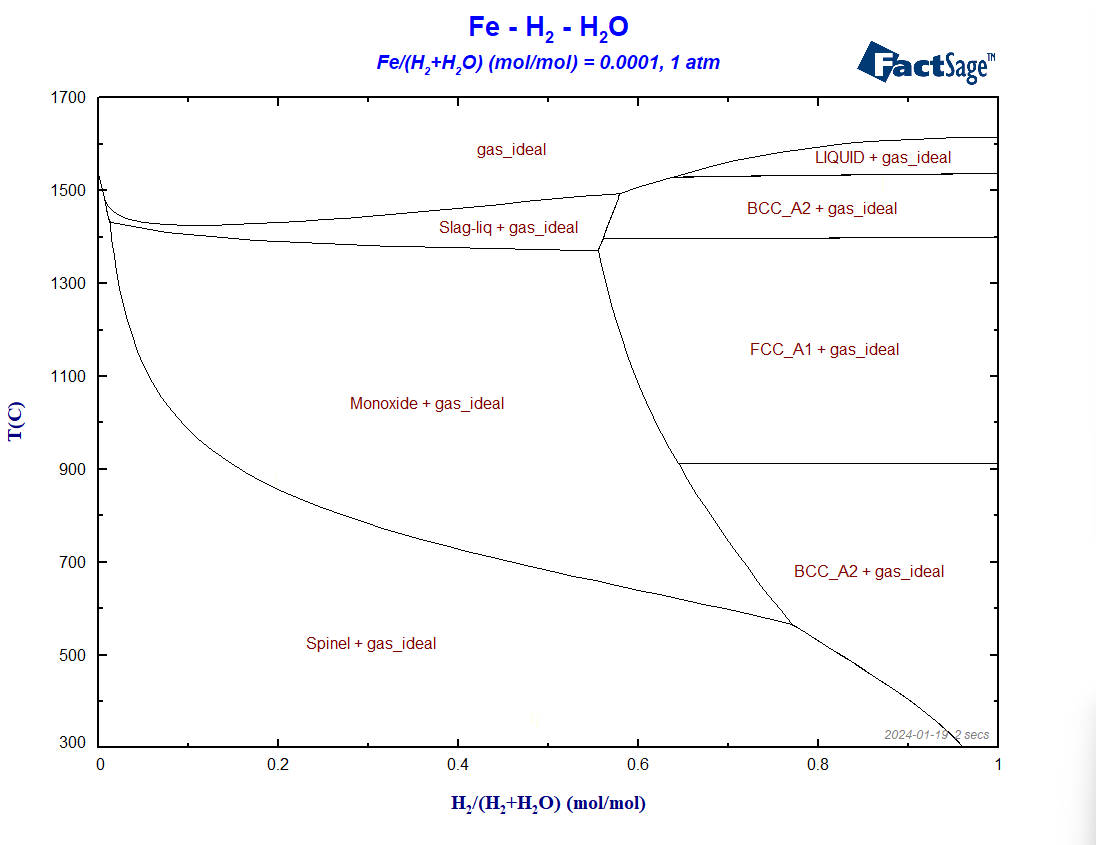
Figure 1 – The BF diagram for the case of reduction with hydrogen
If we compare the above diagram with the corresponding one of the previous blog post, we can determine three main differences between the two: a) the shift of the line corresponding to the spinel/monoxide equilibrium to lower temperatures, b) the enlargement of the regions where only metallic phases and no oxide phases are stable, c) the stability of the metallic BCC phase at 300°C at the reducing side of the diagram.
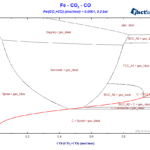
What happens now, if we assume that we would have a CO+H2 mixture instead of having either pure CO or pure H2? One of the ways of doing this in FactSage is to consider a H2+H2O+CO+CO2 mixture and to assume that in this mixture the ratios CO:H2 and CO2:H2O are both fixed. We vary then the ratio (H2+CO)/(H2+CO+H2O+CO2) on the x-axis of the phase diagram. On Figure 2, we show the set-up of the Components window, for the case CO:H2 = CO2:H2O = 1. Note the use of the artificial species COH2 and CO2H2O to do so.
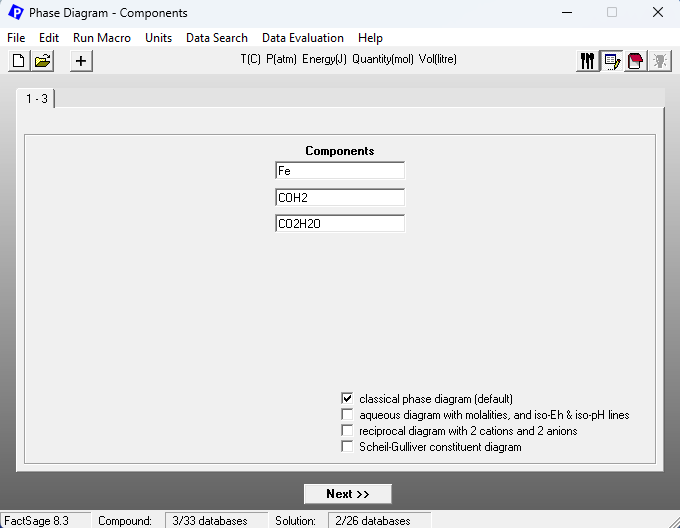
Figure 2 – Components window set-up for the case of reduction employing a CO+H2 mixture
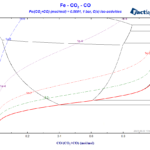
We use in this case the same databases as before. On the Menu Window, we again select all the gaseous species of FactPS and all the solution phases available by default in FToxid and in FSstel. The ratio Fe/(H2+CO+H2O+CO2) is fixed to 0.0001. Because C as graphite may precipitate, we need to include at least C(graphite) as a solid compound species that may form. The resultant diagram in shown on Figure 3.
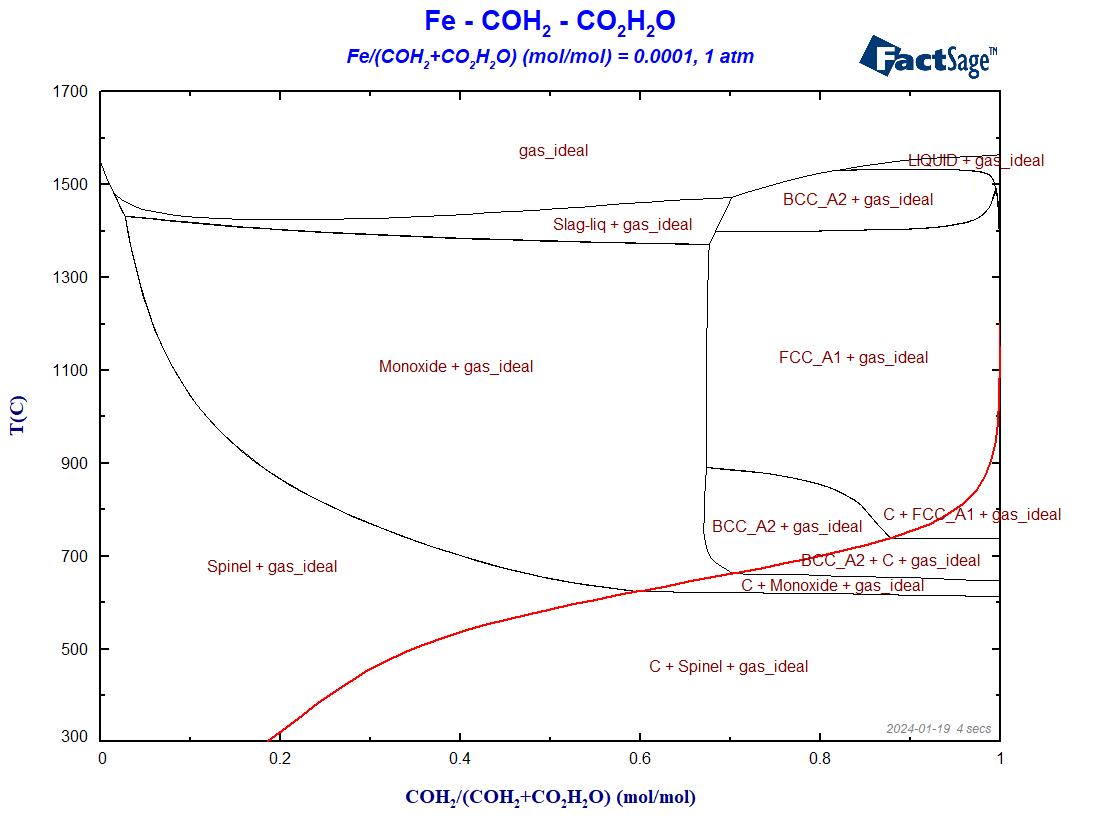
Figure 3 – The BF diagram for the case of reduction with hydrogen plus carbon monoxide
The Boudouard-curve (in red) separates the regions in which graphite is a stable phase (below the curve) from those regions where graphite is thermodynamically not stable. Notice the shift of the Boudouard-curve in this case, in comparison with the situation of the Fe+CO+CO2 phase diagram of the last blog post. In general, the phase regions where only metallic phases and no oxide phases are stable are enlarged in the presence of hydrogen, what seems to indicate that H2 is a better reducing agent than CO for the case of iron.
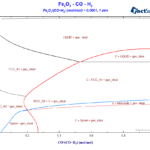
To compare the two reducing agents, CO and H2, directly with one another, we generate now a phase diagram Fe2O3-CO-H2. The procedure is quite similar to the one of the previous diagrams. On the Reactants window, we enter Fe2O3 , H2 and CO as reactants. On the Menu Window, we again select all the gaseous species of FactPS and all the solution phases available by default in FToxid and in FSstel. The ratio Fe2O3/(CO+H2) is fixed to 0.0001. Because C as graphite may precipitate, we need to include again C(graphite) in the calculation. The resultant diagram in shown on Figure 4.
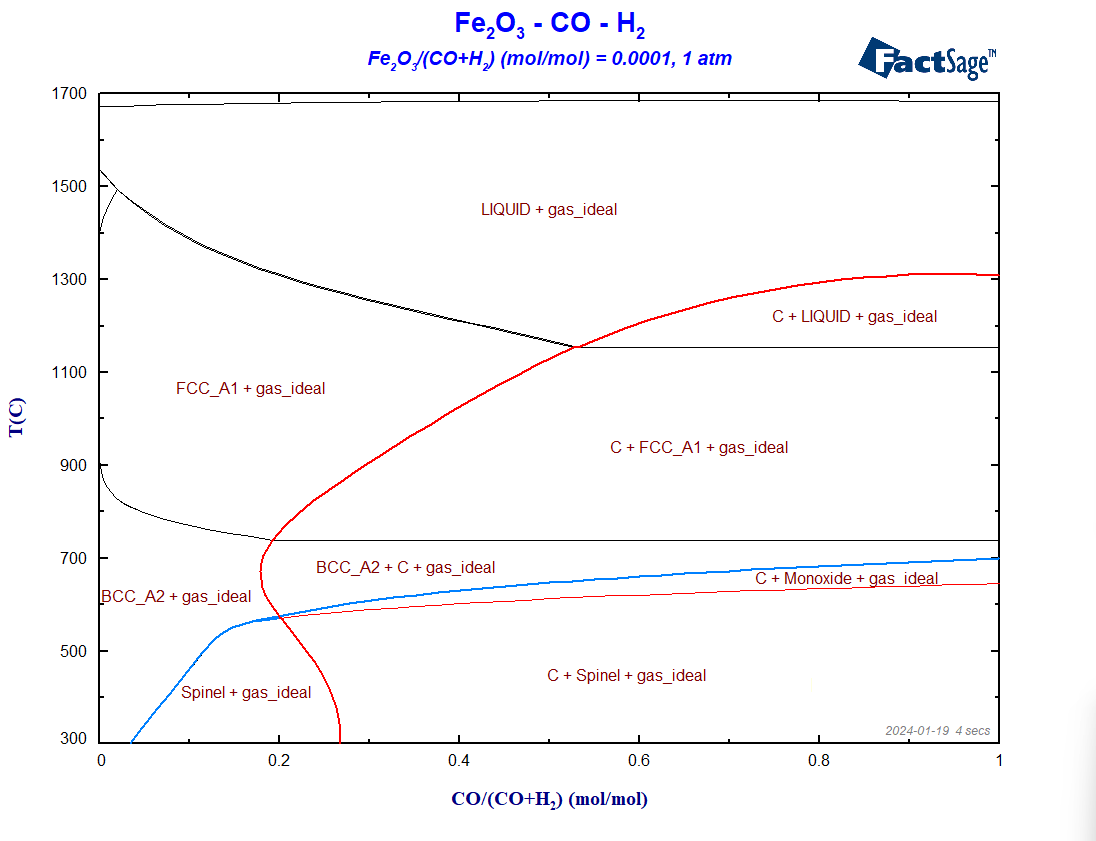
Figure 4 – The phase diagram Fe2O3-H2-CO
Notice how the Boudouard line behaves in this case. It is interesting to notice that, indeed, it is possible to reduce hematite with pure H2, at 300°C, or even at temperatures slightly above room temperature, from the standpoint of thermodynamics. The minimum temperature for the complete reduction from iron oxide to metallic iron increases with the CO content, as shown by the blue curve. If the system only contains CO as a reducing agent, this temperature is around 700°C. It is not possible to reduce Fe2O3 with pure CO at 300°C. Conclusion: H2 is really a better reducing agent than CO for the case of iron. But this comes with a caveat.
With the equilibrium module, one may calculate the final state of equilibrium for the situation of Figure 4, by starting from an initial situation where hematite and the gas mixture have not yet reacted with one another. This allows us to calculate enthalpy changes, ΔH. We assume a temperature of 850°C, typical of the Midrex Process. Let us suppose that, in the initial situation, we have hematite at 850°C isolated from the gaseous mixture, which is also at 850°C and may contain only CO+H2 at varied ratios of CO:H2. Then, we bring the hematite and the gas mixture together and let them react at 850°C. We fix the proportion Fe2O3: (CO+H2) = 0.1, which is the maximum value for this proportion that still guarantees full reduction for all possible input gas compositions. The diagram showing the ΔH as a function of alpha (=H2/(CO+H2)) is shown on Figure 5.
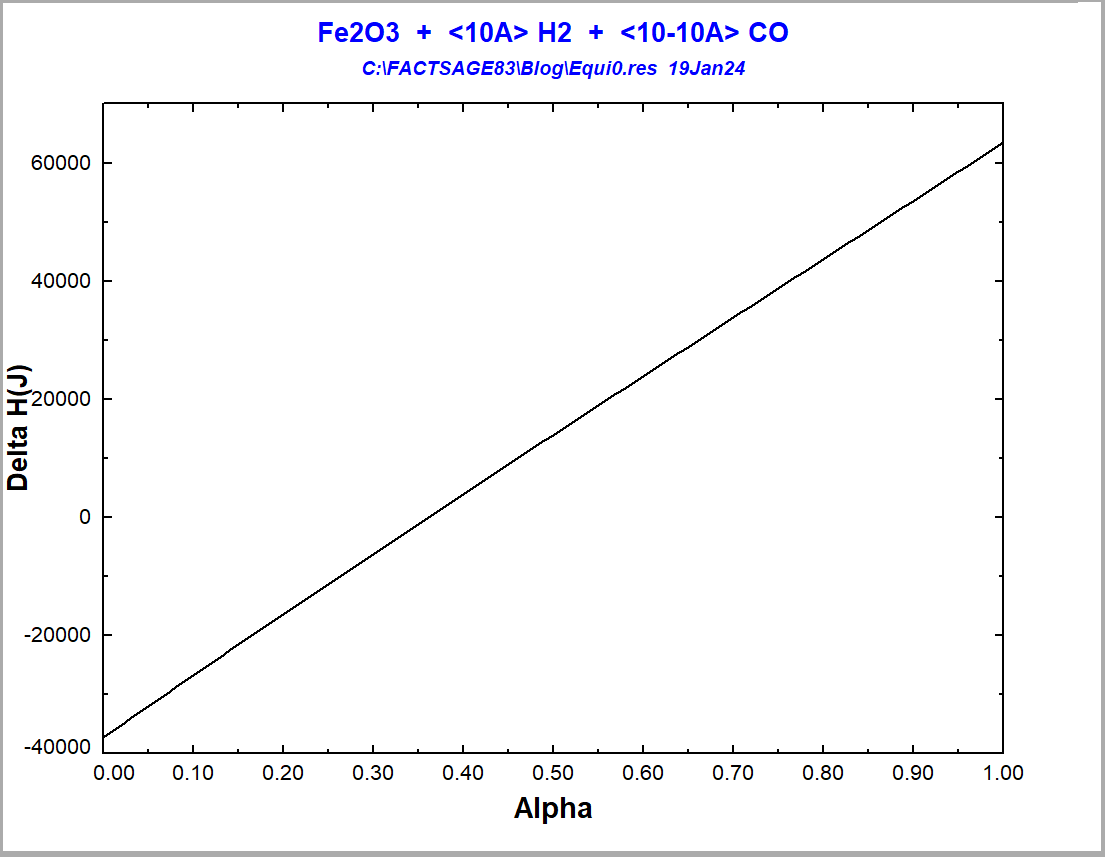
Figure 5 -Enthalpy variation for the reaction of hematite reduction at 850°C depending on the employed reducing gas
One notices that the reaction goes from being exothermic to being endothermic [4], when one enriches the reduction gas more and more with hydrogen. The difference in ΔH between the two extreme situations is 101 kJ. The value of alpha for an adiabatic reduction at 850°C would be alpha=0.36. Considering that the amount of energy that you need only to heat up the reactants to 850°C is 377 kJ in the case of reduction with CO and 363 kJ in the case of reduction with H2, one would need, for an assumed reaction temperature of 850°C, 25% more heat energy to drive the process for the reduction with H2 in comparison to the reduction with CO. For the route using direct reduction with only hydrogen to be really a 100% green one, not only 100% green hydrogen should be injected into the process, but also all the energy needed to drive the process should be generated by using green processes that do not produce any CO2-emissions. All these factors are operational cost drivers [5]. Nevertheless, it is possible to significantly reduce the CO2-emissions of the iron & steel industry by simply implementing in the next decades technologies that are presently already available [5].
This was the last blog of this series dedicated to the Blast Furnace Diagram. We hope that you have enjoyed these applications of FactSage!
References
[2] https://www.power-technology.com/news/tata-steel-hydrogen-injection-blast-furnace/?cf-view
[3] Gudenau HW et al. (1989) Materialsammlung zum Praktikum “Eisenhüttenmännische Verfahrenstechnik”: Vom Erz zum Stahl. Mainz Verlag, Aachen.
[4] Spreitzer D, Schenk J (2019) Reduction of Iron Oxides with Hydrogen—A Review, Steel Research International 90: 1900108.
This post is part of our series Constructing a Blast Furnace Diagram with FactSage: