ChemApp can be used as a very powerful tool at the heart of a process simulation program to determine the chemical equilibria and heat balances involved. The concept of streams in ChemApp is especially helpful in this respect. A stream is a mixture of non-reacted matter of constant temperature and pressure which is transferred to a reaction zone. Several such streams can be defined to constitute the material input for an equilibrium calculation.
It is easy to see how, using the concept of streams, ChemApp can be used to model complex processes and to supplement existing flowsheet programs and process simulators through its ability to calculate highly complex multicomponent, multiphase equilibria very quickly and reliably.
In the present example, a combustion process is simulated using the system C-N-O. While the system itself is very simple, it provides a good basis for demonstration. Particular attention will be paid to the conditions leading to the formation of condensed phases (i.e. precipitates formed during the combustion). With the simple data-file used, this possible precipitate is solid carbon.
In real-life applications similar to the one below, ChemApp may be used with data-files describing systems of up to 30 system components containing many hundreds of species, investigating the cooling of exhaust gases from incineration processes. Using multiple connected reaction ‘chambers’, each at a different temperature, the formation of condensed phases in each stage can be analysed. The result is a simulation program which permits the understanding and optimisation of the process described.
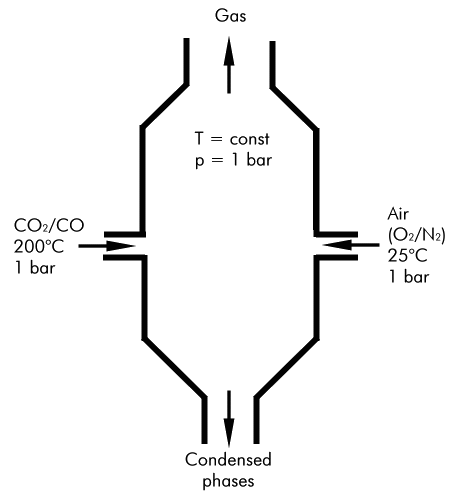
The process we will look at can be sketched as shown in Figure 1.
Figure 1: Sketch of the combustion process investigated
In this example we assume that a mixture of CO2 and CO at 200 C and 1 bar, which can be thought of as an exhaust gas from a previous incomplete combustion process, is entering the reactor. To further combust this gas, air at room temperature is supplied. The air in this example is supposed to consist of O2 and N2 at a ratio of 1:4. The amount of air supplied will be kept constant at first, but varied later on to investigate its influence on the formation of condensed phases. The reaction chamber is kept at a constant temperature. This will also be varied later to look at its influence on the process. In the process considered, the material formed at equilibrium would then be separated into a gas phase and the condensed phases, which leave the reactor in different streams. If the model would be extended to reflect a more complex process, consisting of several different units, these two outputs could in turn make up input streams for subsequent reactor units.
- At first, a single equilibrium calculation is performed for a specific amount of air supplied and for one reaction temperature. The calculated equilibrium state is then investigated, with special attention paid to the formation of phases and some selected extensive property values (heat and volume balances).
- The reaction temperature and the amount of air supplied are then varied separately to investigate their influence on the amount of condensed phases formed.
- To get a feeling for their combined effect, both parameters are then varied simultaneously, and are displayed in a ‘3D’ surface and contour diagram together with the amount of condensed phase formed.
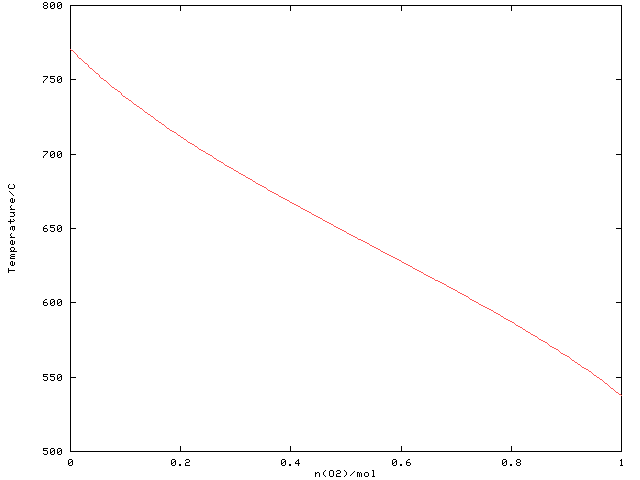
- Assuming that one is particularly interested in finding the conditions under which no precipitates are formed in the process, the necessary values for the reaction temperature and the amount of air supplied to achieve this condition are determined.
C A simple process using streams

C Note that this program contains target calculations,
C which cannot be performed with the 'light' version of ChemApp

C The following function calculates the sum of all equilibrium amounts
C of the condensed phases. It starts with phase #2, since the gas phase
C is #1. The index number of the last phase to be considered is passed
C as an argument to the function, and is retrieved in the main program
C with a call to TQNOP.
      DOUBLE PRECISION FUNCTION GETACP(LASTPH)
      INTEGER LASTPH, I
      DOUBLE PRECISION AMOUNT
      GETACP= 0.D0

C Add up the equilibrium amounts of all condensed phases
      DO I=2, LASTPH
        CALL TQGETR('A ', I, 0, AMOUNT, NOERR)
        GETACP = GETACP + AMOUNT
      ENDDO
      END

C Main program
      PROGRAM CAF103
      IMPLICIT NONE

      INTEGER NOERR, ISLITE, NPHASE, J, K, ICO2, ICO, IO2, IN2
      DOUBLE PRECISION VALS(2), TP(2), RESULT, ACOND, AGAS, TEMP,
     *     IAO2, IAN2, GETACP

C Initialise ChemApp
      CALL TQINI(NOERR)

C Open data-file for reading. In this case, a data-file containing the
C thermochemical data for the system carbon-nitrogen-oxygen is selected.
      OPEN(10, FILE='cno.dat', STATUS='OLD', IOSTAT=NOERR)
      IF (NOERR .NE. 0) THEN
         WRITE(*,*) 'ERROR: Cannot open data-file.'
         STOP
      ENDIF

C Read data-file
      CALL TQRFIL(NOERR)

C Close data-file
      CLOSE(10)

C Since we will perform an extensive property target calculation later,
C we will do the equilibrium calculations using streams. This way we can
C associate an initial state regarding temperature and pressure to the
C incoming substances, which will be taken into account when ChemApp
C calculates the extensive property (e.g. heat) balance.

C Since we are going to use degrees Celsius as temperature unit
C throughout the calculations, we will change the unit now
      CALL TQCSU('Temperature ', 'C ', NOERR)

C According to the process scheme shown above, define the first stream.
C It is the incoming stream of mixed CO2 and CO at 200 C and 1 bar,
C which we will call 'CO2CO'. The amount of CO2 and CO in this stream is
C set to 0.5 and 2.5 mol, respectively.
      TP(1) = 200.D0
      TP(2) = 1.D0
      CALL TQSTTP('CO2CO ', TP, NOERR)
C Set the constituent amounts of CO2 and CO. To do this, get the index
C number of these constituents of the gas phase, which is phase number
C 1.
      CALL TQINPC('CO2 ', 1, ICO2, NOERR)
      CALL TQINPC('CO ', 1, ICO, NOERR)
C Use the index numbers just obtained to set the constituent amounts of
C CO2 in the stream 'CO2CO' to 0.5 mol.
      CALL TQSTCA('CO2CO ', 1, ICO2, .5D0, NOERR)
C Similarly, set the amount of CO in the same stream to 2.5 mol.
      CALL TQSTCA('CO2CO ', 1, ICO, 2.5D0, NOERR)

C Define the second stream ('O2N2'), which is air supplied for the
C combustion at room temperature and 1 bar. The air is assumed to
C consist of O2 and N2 at a ratio of 1:4. The amount of O2 is initially
C set to 0.5 mol (thus N2 = 2.0 mol), it will later be varied.
      TP(1) = 25.D0
      TP(2) = 1.D0
      CALL TQSTTP('O2N2 ', TP, NOERR)
C Get the index numbers of O2 and N2.
      CALL TQINPC('O2 ', 1, IO2, NOERR)
      CALL TQINPC('N2 ', 1, IN2, NOERR)
C Set the amount of O2
      CALL TQSTCA('O2N2 ', 1, IO2, .5D0, NOERR)
C Set the amount of N2
      CALL TQSTCA('O2N2 ', 1, IN2, 2.0D0, NOERR)

C Set the temperature of the reactor at which the equilibrium reaction
C (i.e. the combustion) will take place. It is initially set to 600 C at
C first, but will be varied later.
      CALL TQSTEC('T ', 0, 600.D0, NOERR)

C In the result table to be printed out subsequently, the amount unit
C for the condensed phases formed should be 'gram', while the input was
C given in 'mol'.
      CALL TQCSU('Amount ', 'gram ', NOERR)

C Calculate the equilibrium and print out the result table for a quick
C overview on the equilibrium state
      CALL TQCEL(' ', 0, 0, VALS, NOERR)
Output:
 T =  600.00 C
 P = 1.00000E+00 bar
 V = 3.40047E+02 dm3

 STREAM CONSTITUENTS       AMOUNT/gram   TEMPERATURE/C   PRESSURE/bar STREAM
 CO2/GAS/                   2.2005E+01       200.00       1.0000E+00     1
 CO/GAS/                    7.0026E+01       200.00       1.0000E+00     1
 O2/GAS/                    1.5999E+01        25.00       1.0000E+00     2
 N2/GAS/                    5.6027E+01        25.00       1.0000E+00     2

                           EQUIL AMOUNT  MOLE FRACTION     FUGACITY
 PHASE: GAS                    mol                           bar
 N2                         2.0000E+00     4.2699E-01     4.2699E-01
 CO2                        1.8160E+00     3.8771E-01     3.8771E-01
 CO                         8.6792E-01     1.8530E-01     1.8530E-01
 NO                         4.3199E-17     9.2227E-18     9.2227E-18
 CNO_NCO                    2.6452E-20     5.6473E-21     5.6473E-21
 N2O                        3.0560E-21     6.5244E-22     6.5244E-22
 CN                         2.9723E-21     6.3457E-22     6.3457E-22
 CNO                        2.2356E-21     4.7729E-22     4.7729E-22
 C2O                        3.9875E-23     8.5130E-24     8.5130E-24
 O                          8.1188E-24     1.7333E-24     1.7333E-24
 O2                         3.8588E-24     8.2383E-25     8.2383E-25
 N                          2.2022E-25     4.7016E-26     4.7016E-26
 CN2_NCN                    1.0083E-28     2.1527E-29     2.1527E-29
 NO2                        1.2777E-29     2.7278E-30     2.7278E-30
 N3                         4.1859E-30     8.9367E-31     8.9367E-31
 C2N_CNC                    2.0615E-34     4.4012E-35     4.4012E-35
 C                          8.4509E-35     1.8042E-35     1.8042E-35
 CN2_CNN                    1.9931E-36     4.2552E-37     4.2552E-37
 C3                         1.1284E-38     2.4090E-39     2.4090E-39
 C2                         1.0339E-39     2.2074E-40     2.2074E-40
 C2N_CCN                    2.5088E-41     5.3561E-42     5.3561E-42
 O3                         2.8768E-48     6.1417E-49     6.1417E-49
 NO3                        1.4801E-48     3.1600E-49     3.1600E-49
 C4                         1.1746E-49     2.5077E-50     2.5077E-50
 C5                         8.2283E-50     1.7567E-50     1.7567E-50
 N2O3                       2.7228E-51     5.8129E-52     5.8129E-52
 N2O4                       9.8675E-65     2.1067E-65     2.1067E-65
 N2O5                       0.0000E+00     0.0000E+00    <1.0000E-75
 TOTAL:                     4.6840E+00     1.0000E+00     1.0000E+00
                               gram                        ACTIVITY
 C                          3.7960E+00                    1.0000E+00
 C_DIAMOND_A4               0.0000E+00                    4.7889E-01
 ********************************************************************
   DELTA_Cp       DELTA_H       DELTA_S       DELTA_G       DELTA_V
     J.K-1           J           J.K-1           J            dm3
 ********************************************************************
  2.51143E+01  -2.52713E+05   1.89545E+01  -8.16760E+05   1.60052E+02

 Mass fraction of the system components:
               GAS
 C              2.0115E-01
 N              3.4960E-01
 O              4.4925E-01
|
C As can be seen from the above table, both the gas phase and carbon are
C stable under the conditions chosen. It can also be seen that N2, CO2,
C and CO are the only majority gas phase species. All other gas phase
C species are produced in negligible amounts only.

C The values for the amount of condensed phases and gas phase can be
C retrieved using TQGETR. Since the gas phase, if present in the
C data-file, has always the phase index number 1, this means that we
C have to add up all the amounts of the phases from phase #2 to the last
C one to retrieve the total amount of condensed phases,

C Find out how many phases we have in the data-file, and pass it in all
C subsequent calls to GETACP
      CALL TQNOP(NPHASE, NOERR)

C Get the total equilibrium amount of the condensed phases, using the
C function GETACP declared above.
      ACOND = GETACP(NPHASE)

 11   FORMAT(1X,A,G12.5,A)
      WRITE(UNIT=*,FMT=11) 'Amount of condensed material: ',
     *     ACOND, ' gram'
Output:
Amount of condensed material: 3.7960 gram
|
C Retrieve the amount of gas phase. Note: The current amount unit is
C still 'gram'. If the amount of the gas phase is desired in 'mol'
C instead, TQCSU would need to be called again.
      CALL TQGETR('A ', 1, 0, AGAS, NOERR)

      WRITE(UNIT=*,FMT=11) 'Amount of gas phase: ', AGAS, ' gram'
Output:
Amount of gas phase: 160.26 gram
|
C Retrieve values for some extensive properties.  Since we used streams
C for this example, these extensive property values are calculated
C relative to the incoming streams, when the whole system is selected.

C Get the enthalpy change associated with this reaction.
      CALL TQGETR('H ', 0, 0, RESULT, NOERR)
      WRITE(UNIT=*,FMT=11) 'Delta H: ', RESULT, ' J'

C The negative sign of this value indicates that energy is released from
C the system.

C Get the change in volume of the process, which is the volume of the
C equilibrium gas phase minus the sum of the volumes of the incoming
C streams.
      CALL TQGETR('V ', 0, 0, RESULT, NOERR)
      WRITE(UNIT=*,FMT=11) 'Delta V:', RESULT, ' dm^3'

C Note: using the option 'V' with TQGETR normally would retrieve the
C _total_ volume of the system. There is one exception, in which case it
C retrieves the _change_ in volume, and that is the case when streams
C are used _and_ the whole system (i.e. TQGETR is called using '0,0', as
C above) is selected. To retrieve the _total_ volume instead in the
C present case, use the option 'VT':
      CALL TQGETR('VT ', 0, 0, RESULT, NOERR)
      WRITE(UNIT=*,FMT=11) 'Total V:', RESULT, ' dm^3'
Output:
 Delta H: -0.25271E+06 J
 Delta V:  160.05     dm^3
 Total V:  340.05     dm^3
|
C Compare the two values for the volume with the corresponding ones in
C the output table produced earlier. The volume printed at the top of
C such an output table is always the _total_ volume, whereas the line
C specifying the extensive property balance toward the end of the table
C shows the _change_ in volume.

C TQSTXP can be used to retrieve extensive property values for the
C incoming streams. Get the volume of the incoming CO2/CO stream:
      CALL TQSTXP('CO2CO ', 'V ', RESULT, NOERR)
      WRITE(UNIT=*,FMT=11) 'V(CO2CO): ', RESULT, ' dm^3'

C Get the value of the incoming air stream:
      CALL TQSTXP('O2N2 ', 'V ', RESULT, NOERR)
      WRITE(UNIT=*,FMT=11) 'V(O2N2): ', RESULT, ' dm^3'
Output:
 V(CO2CO):   118.02     dm^3
 V(O2N2):   61.974     dm^3
|
C For users of ChemApp versions prior to 3.2.0: Please note that the
C values returned by TQSTXP always refer to the _last_ calculated
C equilibrium state. Even if one uses TQSTXP to retrieve properties of
C _incoming_ streams, one thus needs to perform an equilibrium
C calculation before the correct values are obtained. If TQSTXP is
C called before the first equilibrium calculation has been made using
C TQCE or TQCEL, VAL will be zero.

C As of version 3.2.0 of ChemApp, TQSTXP can also be called _before_ the
C equilibrium calculation)

C As can be seen from the above results, this process, under the
C conditions we have chosen, results in solids to be formed in the
C reactor. We will now investigate this systems further by looking at
C how the amount of condensed material changes when
C a) the reaction temperature is varied, and
C b) the amount of air supplied is varied.


C ****************************************************************
C Varying the reaction temperature
C ****************************************************************

C Since several individual equilibria will be calculated, the results
C (temperature and amount of condensed phases) will be stored to a file
C for further processing.
      OPEN(11, FILE='caf103_1.rst', STATUS='unknown', IOSTAT=NOERR)
      IF (NOERR .NE. 0) THEN
         WRITE(*,*) 'ERROR: Cannot open result file.'
         STOP
      ENDIF

C Vary the temperature between 200 C and 1000 C in steps of 5 C
      DO J=200, 1000, 5

C Use the variable TEMP to hold the current temperature.
         TEMP = J
         CALL TQSTEC('T ', 0, TEMP, NOERR)

C Calculate the equilibrium. In this case, we only need the value for the
C amount of condensed phases formed, therefore TQCE is used and not
C TQCEL.
         CALL TQCE(' ', 0, 0, VALS, NOERR)

C Get the amount of condensed phases
         ACOND = GETACP(NPHASE)

C Write the temperature and the amount of condensed phases to the result
C file
 12      FORMAT(2E12.5)
         WRITE(11,FMT=12) TEMP, ACOND
      ENDDO

C Close the result file
      CLOSE(11)

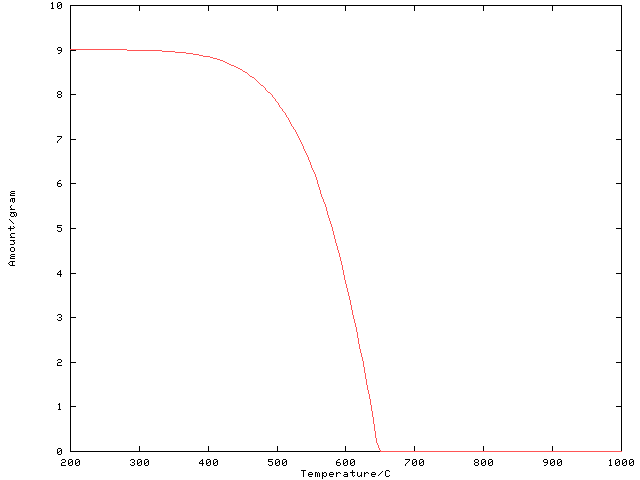
C When plotted, the resulting graph looks like Figure 4
C ****************************************************************
C Varying the amount of air supplied
C ****************************************************************

C Instead of the temperature, the amount of incoming air will be varied
C now. The temperature will be kept constant at the initial value of
C 600 C. To plot the result later on, we will again store them in a
C separate file.
      OPEN(11, FILE='caf103_2.rst', STATUS='unknown', IOSTAT=NOERR)
      IF (NOERR .NE. 0) THEN
         WRITE(*,*) 'ERROR: Cannot open result file.'
         STOP
      ENDIF

C Set the temperature for the equilibrium calculation (600 C)
      CALL TQSTEC('T ', 0, 600.D0, NOERR)

C Calculate 201 equilibria...
      DO J=0, 200

C ... with the O2 amount varying between 0 and 1 mol...
         IAO2 = J * 0.005D0
C ... and the N2 amount between 0 and 4 mol.
         IAN2 = IAO2 * 4.D0

C To make sure ChemApp interprets these values as 'mol', set the amount
C unit accordingly
         CALL TQCSU('Amount ', 'mol ', NOERR)

C Set the amount of O2 in the air stream
         CALL TQSTCA('O2N2 ', 1, IO2, IAO2, NOERR)
C Set the amount of N2 in the air stream
         CALL TQSTCA('O2N2 ', 1, IN2, IAN2, NOERR)

C Calculate the equilibrium
         CALL TQCE(' ', 0, 0, VALS, NOERR)

C Set the amount unit to 'gram'
         CALL TQCSU('Amount ', 'gram ', NOERR)

C Get the amount of condensed phases
         ACOND = GETACP(NPHASE)

C Write the amounts of O2 and condensed phases to the result file
         WRITE(11,FMT=12) IAO2, ACOND
      ENDDO

C Close the result file
      CLOSE(11)

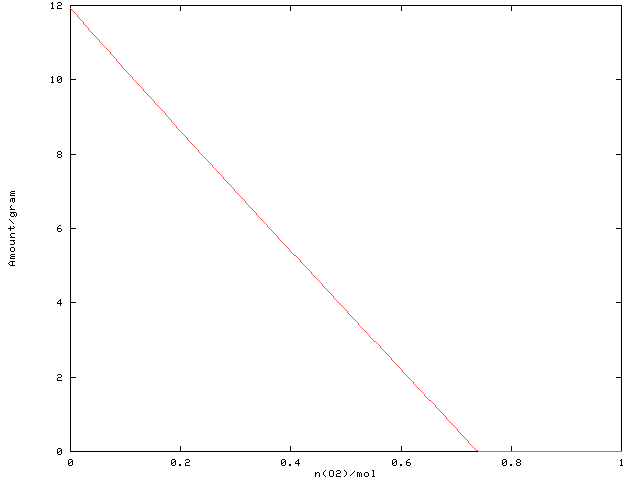
C When plotted, the resulting graph looks like Figure 5
Figure 5: Calculated amount of condensed phases as a function of the O2 amount supplied. The temperature is kept constant at 600 C.
C ****************************************************************
C Varying the amount of air supplied _and_ the temperature
C ****************************************************************

C To investigate the combined influence of temperature and amount of air
C supplied on the resulting amount of condensed phases, both parameters
C are varied in nested loops. The results are again stored in a file for
C further processing.
      OPEN(11, FILE='caf103_3.rst', STATUS='unknown', IOSTAT=NOERR)
      IF (NOERR .NE. 0) THEN
         WRITE(*,*) 'ERROR: Cannot open result file.'
         STOP
      ENDIF

C The outer loop will vary the temperature between 200 C and 1000 C
      DO J=200, 1000, 20

         TEMP = J
         CALL TQSTEC('T ', 0, TEMP, NOERR)

C The inner loop varies the amount of incoming air as above.
         DO K=0, 200, 5

            IAO2 = K * 0.005D0
            IAN2 = IAO2 * 4.D0

            CALL TQCSU('Amount ', 'mol ', NOERR)
C Set the incoming amount of O2
            CALL TQSTCA('O2N2 ', 1, IO2, IAO2, NOERR)
C Set the incoming amount of N2
            CALL TQSTCA('O2N2 ', 1, IN2, IAN2, NOERR)

            CALL TQCE(' ', 0, 0, VALS, NOERR)

            CALL TQCSU('Amount ', 'gram ', NOERR)

C Get the amount of condensed phases
            ACOND = GETACP(NPHASE)

C Write the temperature and the amounts of O2 and condensed phases to
C the result file
 13         FORMAT(3E12.5)
            WRITE(11,FMT=13) TEMP, IAO2, ACOND

         ENDDO
         WRITE(11,*)

      ENDDO

C Close the result file
      CLOSE(11)

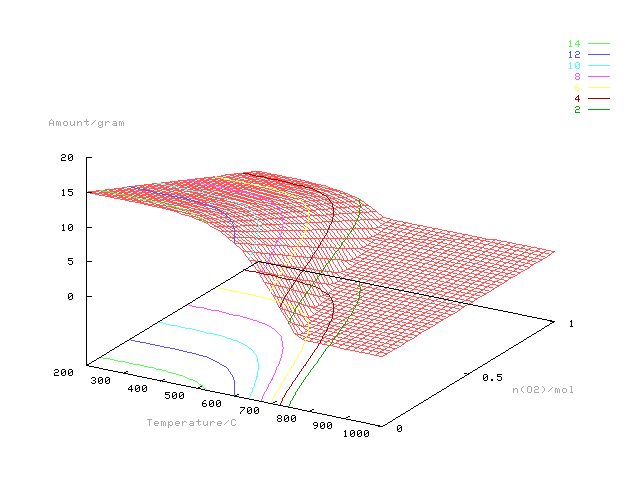
C When plotted, the resulting graph looks like Figure 6
C Check if we are working with the 'light' version.
C If we do, omit the following target calculation(s).
      CALL TQLITE(ISLITE, NOERR)
      IF (ISLITE .EQ. 1) THEN
         WRITE(*,FMT='(3(1X,A,/))')
     *     '*** Target calculations have been omitted here,',
     *     '*** since they are not possible with the ',
     *     '*** ''light'' version of ChemApp.'

      ELSE

C ****************************************************************
C Varying the amount of air supplied _and_ the temperature, searching
C for the explicit condition where the amount of condensed phase is zero.
C ****************************************************************

C Assuming that one is interested in the above process _not_ producing
C any condensed phases (i.e. complete combustion), it would be helpful
C to have a diagram which corresponds to the bottom plane of the above
C figure: A graph which, as a function of the incoming amount of air,
C shows the temperature at which the amount of condensed phases formed
C is zero.

C For the calculation procedure with ChemApp, this results in the
C following steps:
C 1) We are looking for the temperature at which condensed phases _just_
C    start to form. In terms of ChemApp, we thus have to define a
C    precipitation target with respect to the gas phase.
C 2) For each value of the amount of air supplied, define the 'O2N2'
C    stream with the proper amounts of O2 and N2.
C 3) ChemApp is then supposed to vary the temperature until the target
C    (a phase precipitates from the gas phase) is met. Temperature is
C    thus the target variable. This is specified as a parameter to TQCE,
C    together with an estimated value.
C 4) The equilibrium is calculated for each of the amounts of air
C    supplied, then the equilibrium temperature is retrieved and stored in
C    the result file.
      OPEN(11, FILE='caf103_4.rst', STATUS='unknown', IOSTAT=NOERR)
      IF (NOERR .NE. 0) THEN
         WRITE(*,*) 'ERROR: Cannot open result file.'
         STOP
      ENDIF

C Reset the amount unit to 'mol'
      CALL TQCSU('Amount ', 'mol ', NOERR)

C Define the target as a precipitation target ('-1') for the gas
C phase (phase index 1)
      CALL TQSTEC('A ', 1, -1.D0, NOERR)

C The initial estimate for the temperature is passed via the first
C element of VALS to subsequent calls to TQCE
      VALS(1) = 600.D0

C Vary the amount of supplied air
      DO J=0, 200

         IAO2 = J * 0.005D0
         IAN2 = IAO2 * 4.D0
C Set the incoming amount of O2
         CALL TQSTCA('O2N2 ', 1, IO2, IAO2, NOERR)
C Set the incoming amount of N2
         CALL TQSTCA('O2N2 ', 1, IN2, IAN2, NOERR)

C Define the target variable (temperature), with the initial estimate in
C the first element of VALS, and calculate the equilibrium
         CALL TQCE('T ', 0, 0, VALS, NOERR)

C Retrieve the calculated equilibrium temperature
         CALL TQGETR('T ', 0, 0, TEMP, NOERR)

C Store the amount of O2 supplied and the calculated equilibrium
C temperature to the result file
         WRITE(11,FMT=12) IAO2, TEMP
      ENDDO

C Close data-file
      CLOSE(11)

C When plotted, the resulting graph looks like Figure 7
Figure 7: The curve represents the border between the area where condensed phases are formed (below the curve) and where the gas phase is the only one stable (above the curve). It represents the explicitly calculated contour for a zero amount of condensed phases in Figure 6.
ENDIF
END
Jump back to the code example “Phase Equilibria and Phase Target Calculations” or “One-Dimensional Phase Mapping“.

