Phase diagram

Constructing a Blast Furnace Diagram with FactSage 8.2

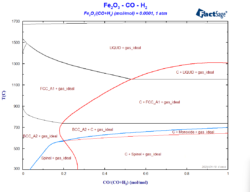
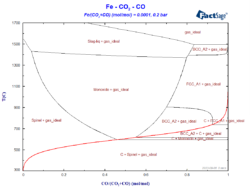
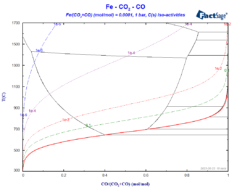
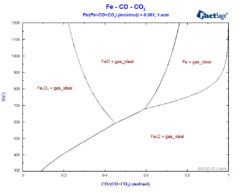
The so-called blast-furnace diagram describes which phases are stable in the different regions of the blast furnace, depending on the conditions of temperature and of the atmosphere inside the furnace[1]. It is basically a phase diagram, where the volume fraction of CO is represented on the X-axis and the temperature is represented on the Y-axis, …

Constructing a Blast Furnace Diagram with FactSage 8.2 Read More »

Minimization of copper losses to the converter slag through a boron oxide addition

The loss of copper in the converting process through its incorporation to the converter slag represents a major problem in the copper metallurgy. There are two important mechanisms for this phenomenon: the physicochemical and the mechanical one. The mechanical mechanism, i.e. the mechanical entrapment of matte or of metallic copper inside the slag, is by …

Minimization of copper losses to the converter slag through a boron oxide addition Read More »

A hands-on example for a phase-diagram-module calculation

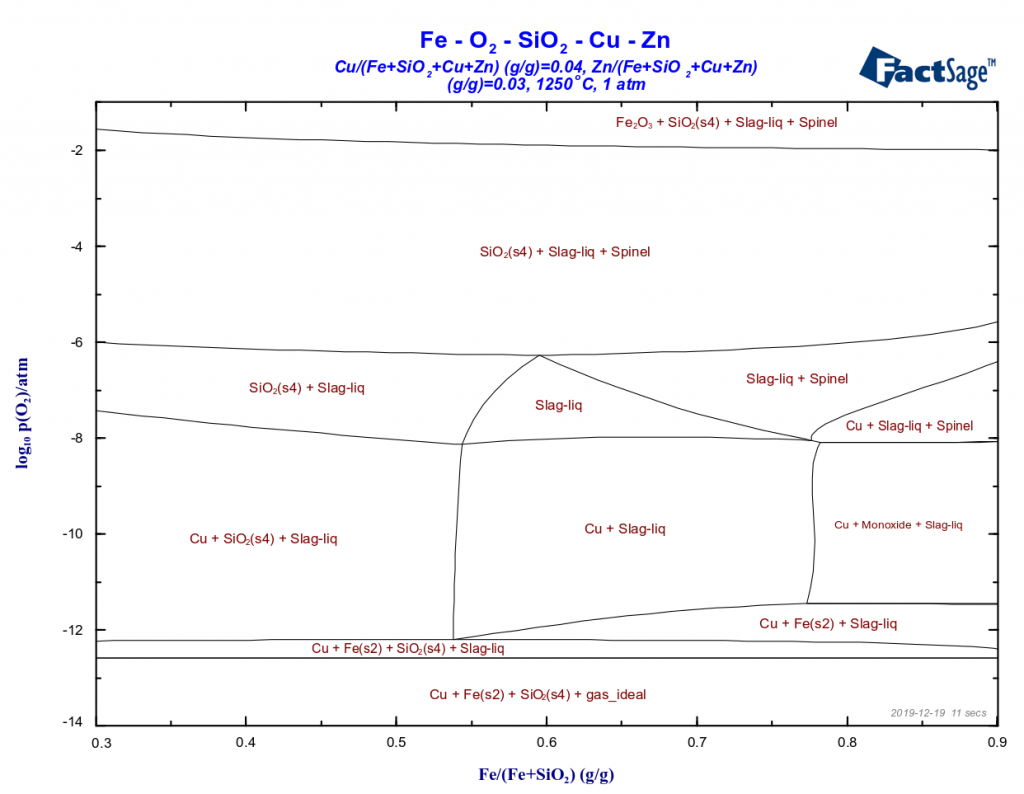
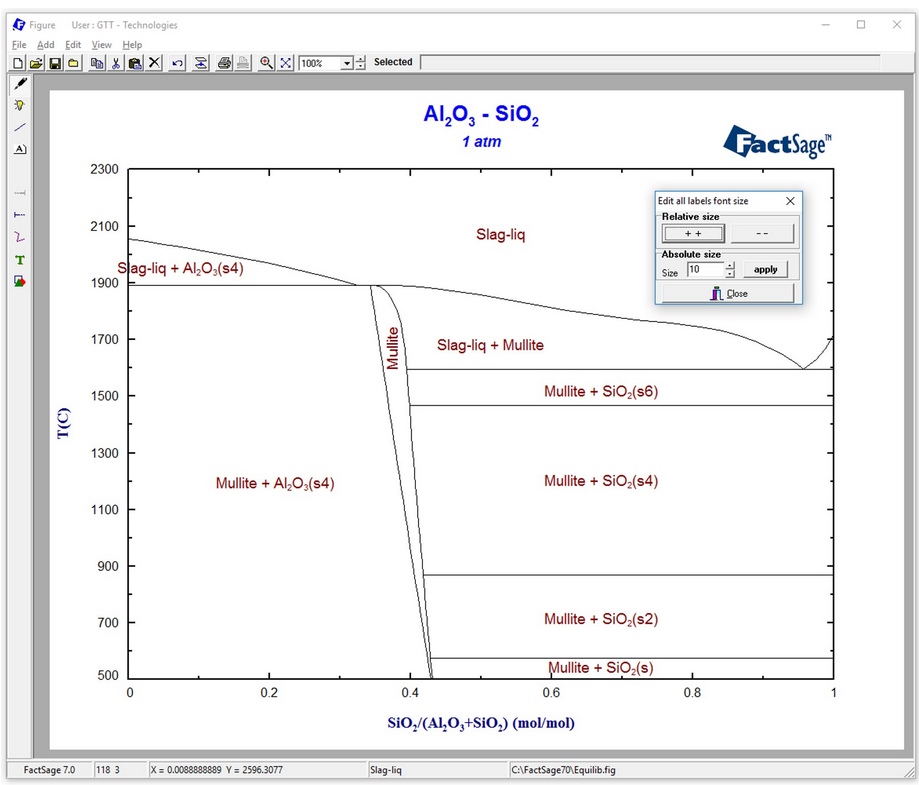
FactSage contains many modules. The major ones for daily work are Equilib and Phase Diagram. Phase Diagram permits the calculation of phase diagram sections for systems with any number of components. Components can be elements, compounds or even arbitrary compositions. For a phase diagram calculation, first the components of interest have to be defined. Then, the possible …

A hands-on example for a phase-diagram-module calculation Read More »