FactSage contains many modules. The major ones for daily work are Equilib and Phase Diagram.
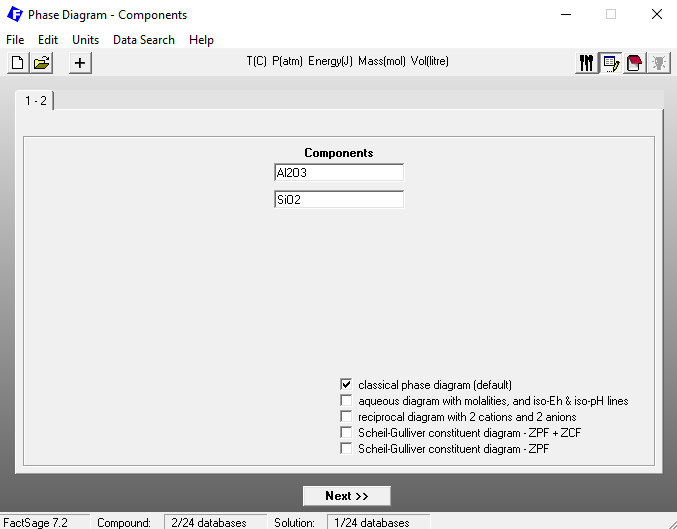
Phase Diagram permits the calculation of phase diagram sections for systems with any number of components. Components can be elements, compounds or even arbitrary compositions. For a phase diagram calculation, first the components of interest have to be defined.
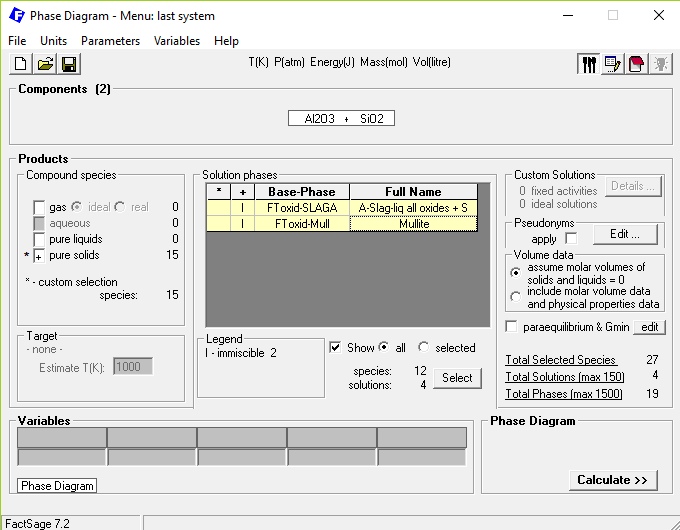
Then, the possible products to be considered have to be selected, as well as the calculation conditions. For a global Gibbs energy minimization, all possible products in a database can normally be included in the calculation. For further information on how to include non-equilibrium processes in a phase diagram calculation, please check out the section on non-equilibrium applications. Additionally, calculation features such as liquidus projection or the calculation of isoactivity lines can be activated here.
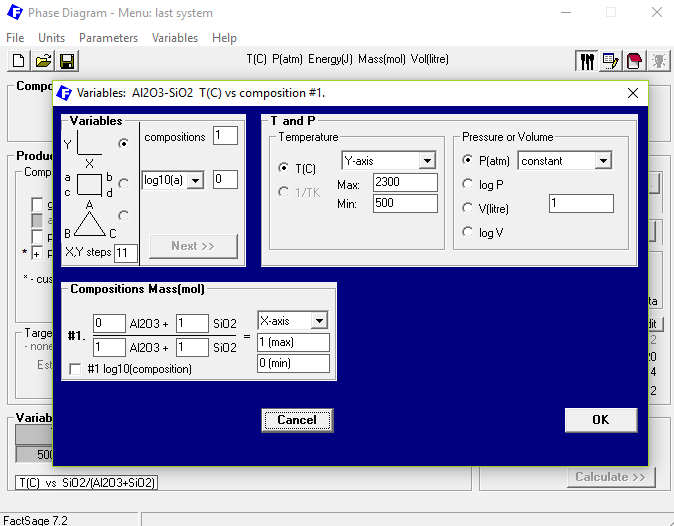
Finally, the axis variables and constants have to be defined. There is a wide choice of axis variables and constants (temperature, pressure, composition, composition ratios, component activities, partial pressures or chemical potentials) and diagrams can be plotted on orthogonal co-ordinates or on a Gibbs triangle. Special types of phase diagrams, namely liquidus and solidus surfaces and Scheil cooling diagrams, can also be calculated.
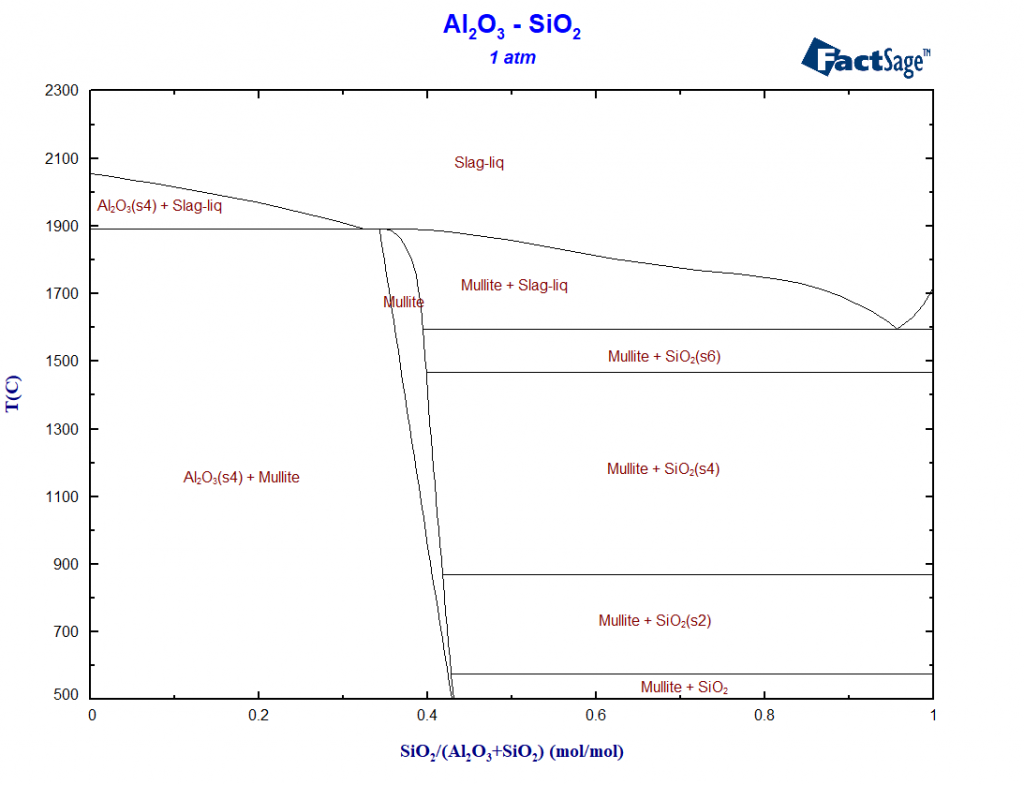
The calculated phase diagram turns into a new user interface that permits the positioning of phase labels, the selection and colouring of zero phase fraction lines, the calculation and plotting of tie-lines, or the calculation and display of point equilibria in the form of Equilib tables.
The Figure module is a full graphical package which permits further manipulation of labels, import of experimental points, “zooming” etc., in orthogonal as well as triangular (Gibbs triangle) coordinates.
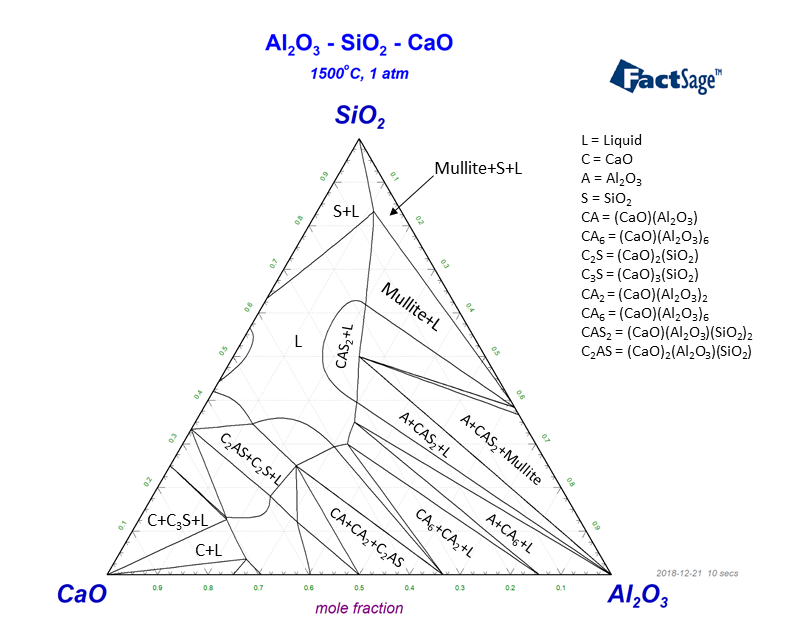
Do you want to check out one of the pre-calculated Phase diagrams? Use the Phase Diagram-Web feature developed by our partners at ThermFact/CRCT! As an example, have a look at the figure below, showing an isothermal section of the ternary system Al2O3 SiO2-CaO, a chemical system that is of interest both for metallurgical slags and refractory material design.
Hi, I need a rotary kiln simulator for my project. could you please let me know how I can download it? is there a trial version available? it is not how much does it cost?
Hi,
Thank you for your interest in our rotary kiln simulation software KilnSimu! To get detailed information about availability, pricing, and potential trial options, please submit a ticket in our support system:
https://support.gtt-technologies.de/
Our experts will be happy to assist you and provide the best solution for your project.
Best regards, Friederike Herrig