In the 3rd blog post of this series related to the Blast Furnace Diagram, we at first consider the effect of including the metallic phases as solution phases instead of considering them as pure compounds, like we already did for the oxides. Then, we show how the total pressure will affect the diagram, in special the Boudouard reaction. This blog post was written in collaboration with Klaus Hack.
To include the metallic solid solutions, we take as a basis the set-up used for generating Figure 7 of the previous blog post, for the generation of which we have already considered the oxide solution phases. The first thing to do is to include in the Data Search window FSstel as an additional database, as depicted in Figure 1.
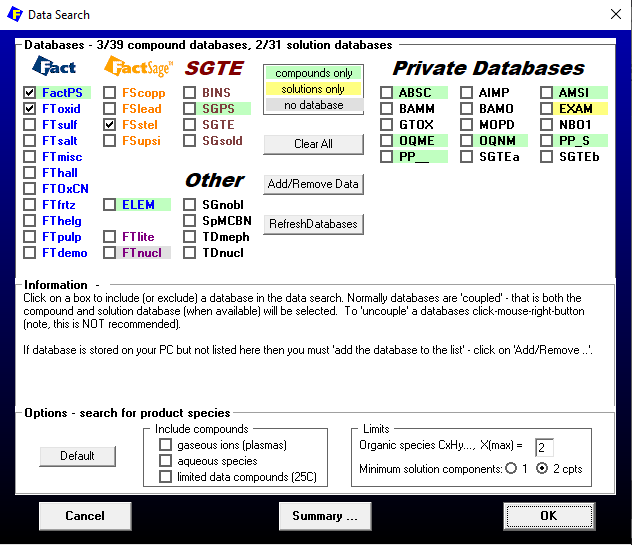
Figure 1 – Database selection for the case in which both oxides and metals are included as solution phases
Next, in the Menu Window, we select all available solution phases. As for the gas species, the set-up is the same as in the previous blog post. The selection of the pure solids can be simplified in the present case: we just need to select: KSI_carbide, Cementite, C(graphite) and C(diamond). No pure liquids need to be included in the calculation, since both the slag (SLAGA) and the liquid metallic melt (Liqu) are included. The Menu window set-up is shown in Figure 2.
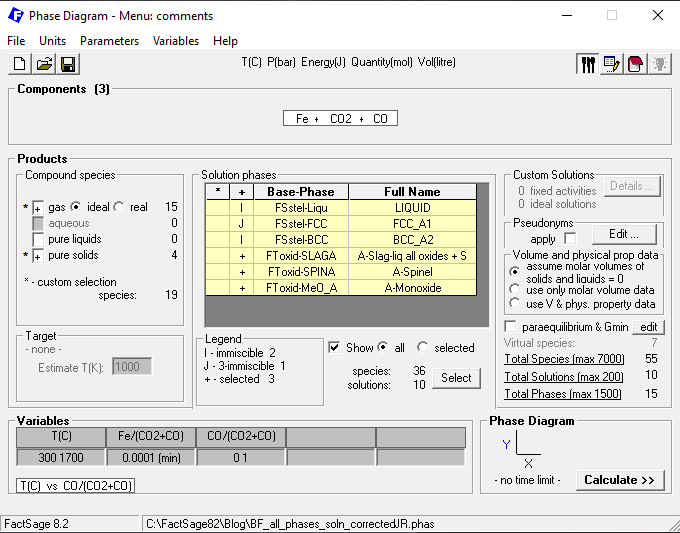
Figure 2 – Menu window set-up for the case in which both oxides and metals are included as solution phases
The variables selection for the phase diagram does not need to be altered in relation to the case of the previous blog post. When we press on “Calculate”, the phase diagram shown in Figure 3 will be generated.
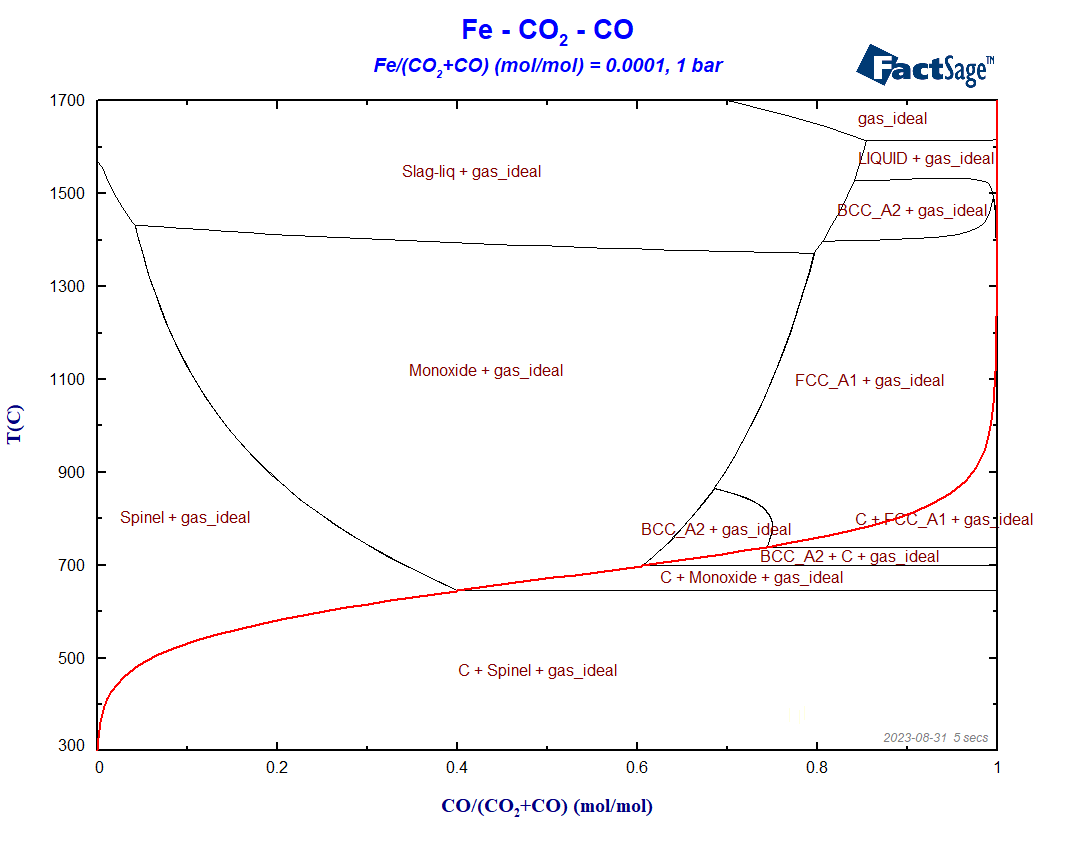
Figure 3 – Calculated blast furnace diagram for the most general phase selection set-up
Notice that under reducing conditions, i.e. for X(CO) > 0.5, the phase regions undergo considerable changes in comparison with Figure 7 of the previous blog post, because now both carbon and oxygen may be incorporated as solutes to Fe(bcc), Fe (fcc) and Fe(liq). The Boudouard-curve (in red) separates the regions in which graphite is a stable phase (below the curve) from those regions where graphite is thermodynamically not stable.
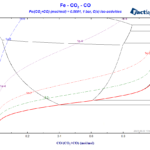
What happens now if the total pressure of the system is changed? To check on the effect of a pressure change, we just need to change it in the variables window of the phase diagram module (please check Figure 3 of the previous blog post as a reference). Figure 4 shows the phase diagram obtained with the same configuration as in the previous one, but for a total pressure of 5 bar.
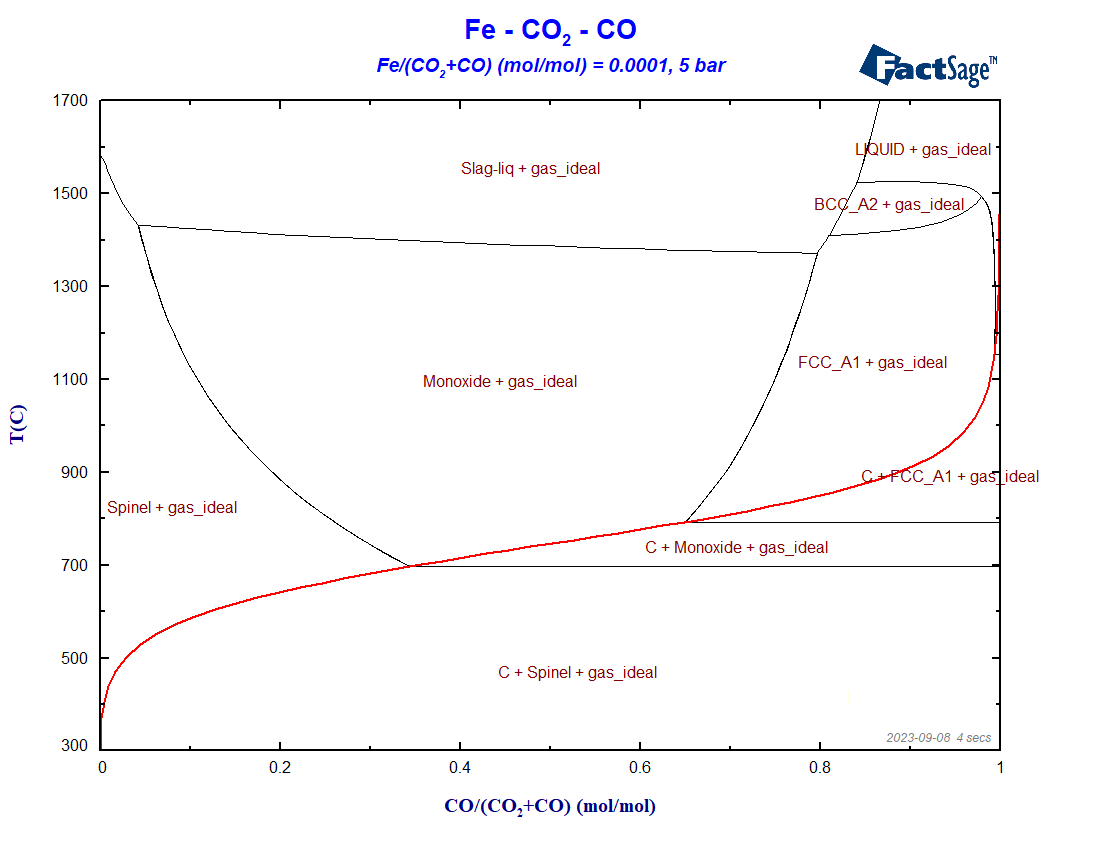
Figure 4 – Blast furnace diagram for a total system pressure equal to 5 bar
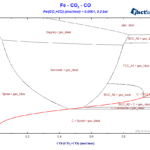
Figure 5 shows the phase diagram for essentially the same set-up, but now for a total pressure of 0.2 bar.
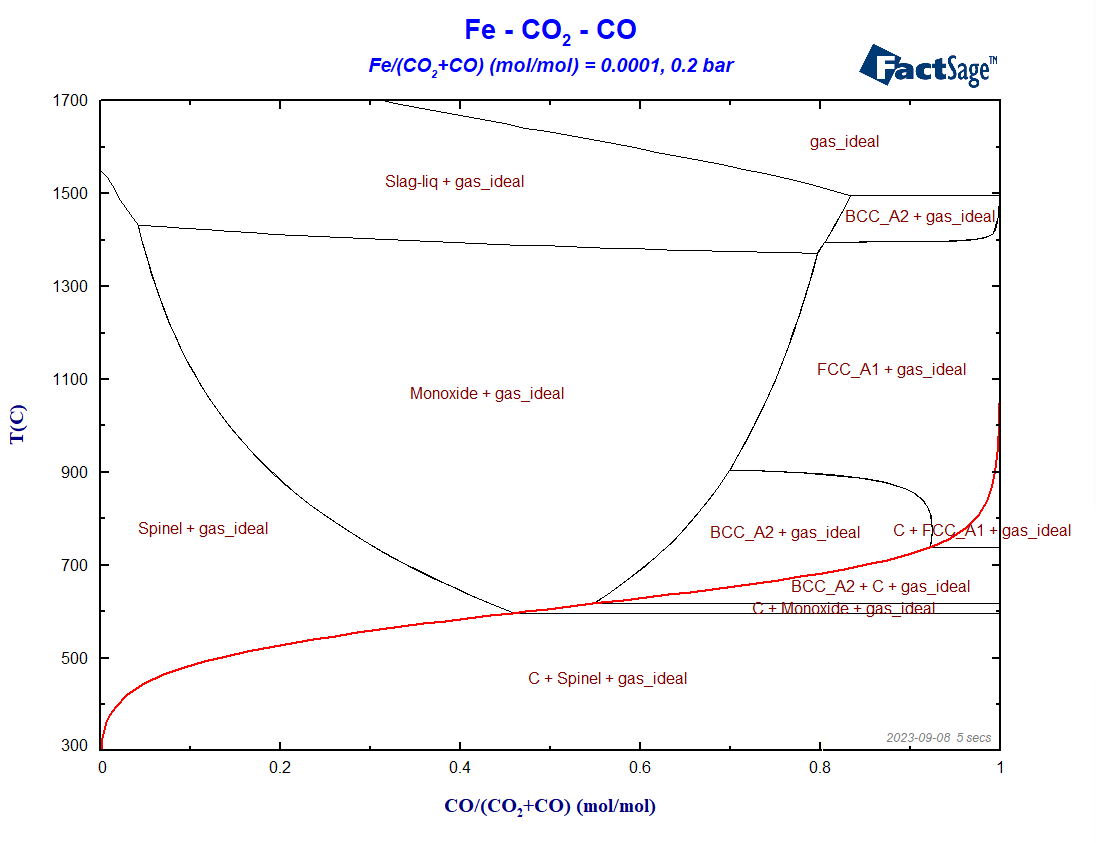
Figure 5 – Blast furnace diagram for a total system pressure equal to 0.2 bar
Notice the shifting of the Boudouard equilibrium to higher temperatures for pressures higher than 1 bar, and to lower temperatures for pressures lower than 1 bar, taking as a reference the initial situation P = 1 bar. This is consistent with the principle by Le Chatelier, according to which an increase in pressure should favor phases with higher density. In this case, the region where C(graphite) shows up increases in size for P > 1 bar, in comparison with the initial situation. Another interesting feature is the stabilization of ferrite under reducing conditions for pressures lower than atmospheric pressures. Lowering the total pressure leads to an increase of the carbon content in the gas phase and to a decrease of the carbon concentration in the condensed metallic solutions. This stabilizes ferrite to the detriment of austenite, because carbon is a known austenite stabilizer.
That is it for the time being. What if carbon is not the reducing agent but hydrogen? This will be the topic of the next blog post… see you!
This post is part of our series Constructing a Blast Furnace Diagram with FactSage:


Pingback: reduce the CO2 emissions caused by the iron & steel industry