In a series of posts, we will focus on the relation between phase diagrams, Gibbs energy functions and activities. Let us begin with the Al-Cu phase diagram at a temperature of 500 °C. In this blog post we will work exclusively with the FactSage Education Package. Let us suppose we have generated an Al-Cu phase-diagram like the one below.
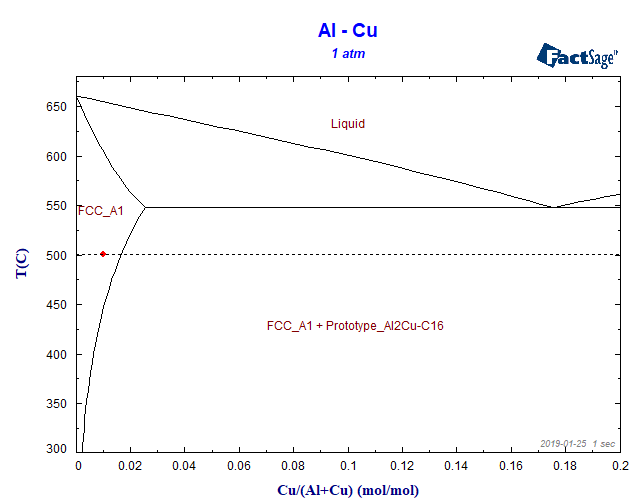
Figure 1
Where we have indicated a specific alloy composition with a molar fraction of XCu = 0.01 in the FCC phase region. The first question is: at 500 °C we should have only the FCC phase as an equilibrium phase, shouldn’t we? But how far we are in terms of the Cu-content from the formation of the first Al2Cu precipitate at this temperature? The condition for the chemical equilibrium is:
$$μ_{Cu}^{FCC} = μ_{Cu}^{Al_2Cu}$$
$$μ_{Al}^{FCC} = μ_{Al}^{Al_2Cu}$$
where the chemical potential is related to the molar free energy of a generic α phase by
$$μ_i^{α} = G^{α}-X_i{\partial G^{α} \over \partial X_i}$$
α stands for the FCC-phase or for the Al2Cu-phase and i stands for the chemical species, in this case Al or Cu.
So, the equations for the chemical equilibrium are directly related to the free energy curves and to their derivatives. We can obtain the concentrations of the phase boundaries as described below: we will use the equilibrium module of FactSage Education.
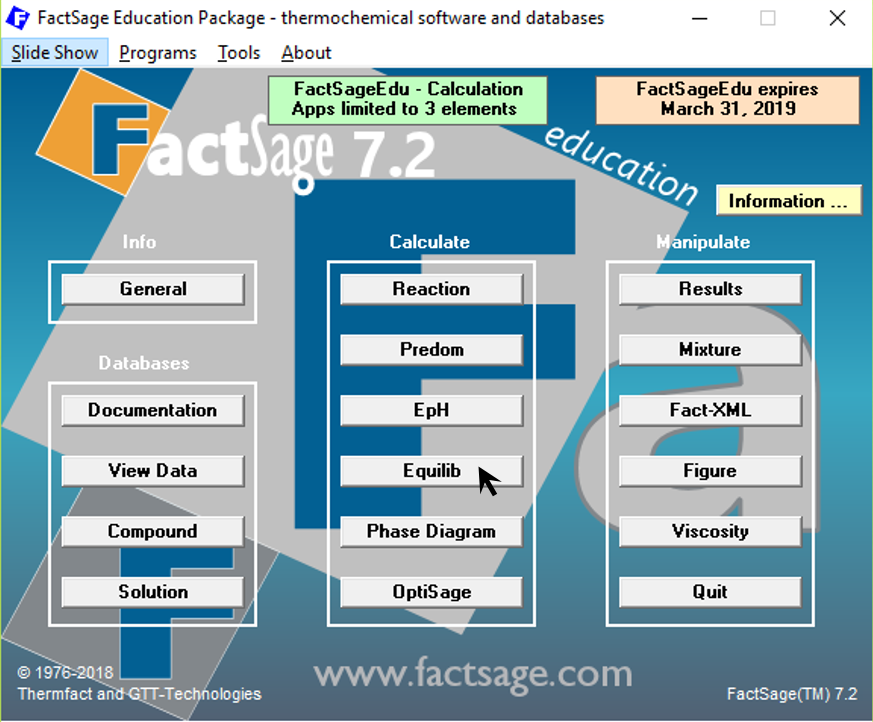
Figure 2
We choose the database FTlite from the menu item “Data Search”.
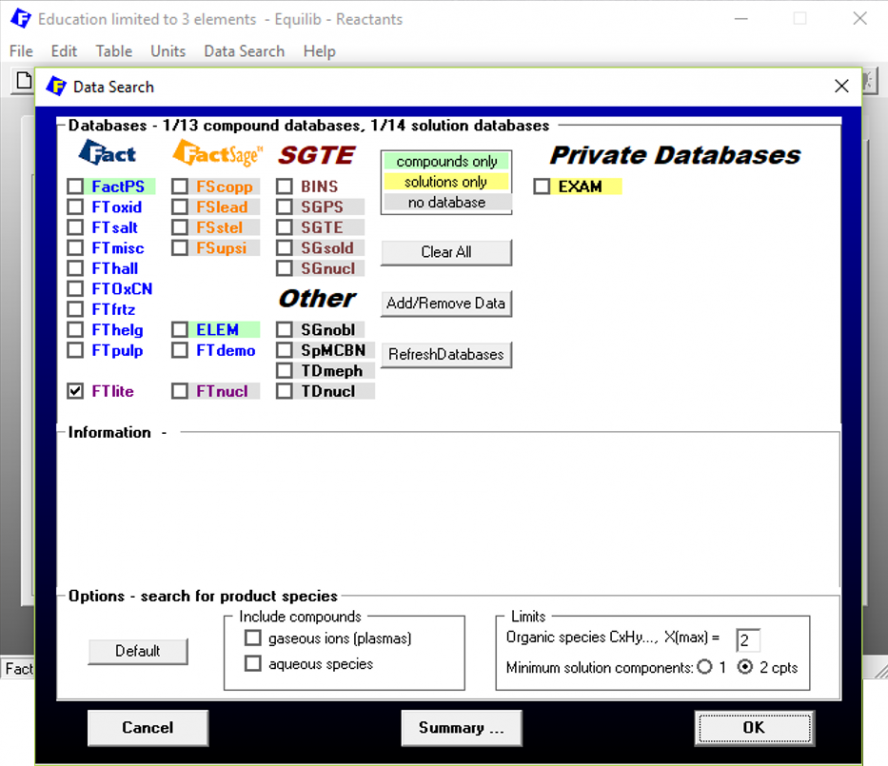
Figure 3
To vary the chemical composition of the system, we define the variables < A > and < 1 – A >, which represent the copper and the aluminium molar fractions in the system.
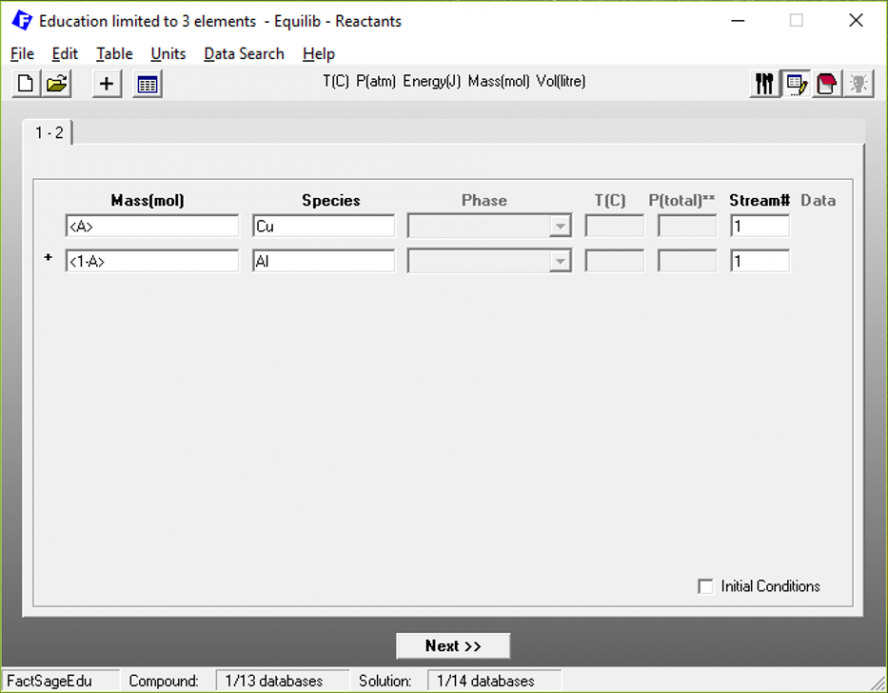
Figure 4
After clicking on “Next”, we go over to the main menu, where we define how < A > should vary and which phases are to be considered in the calculation.
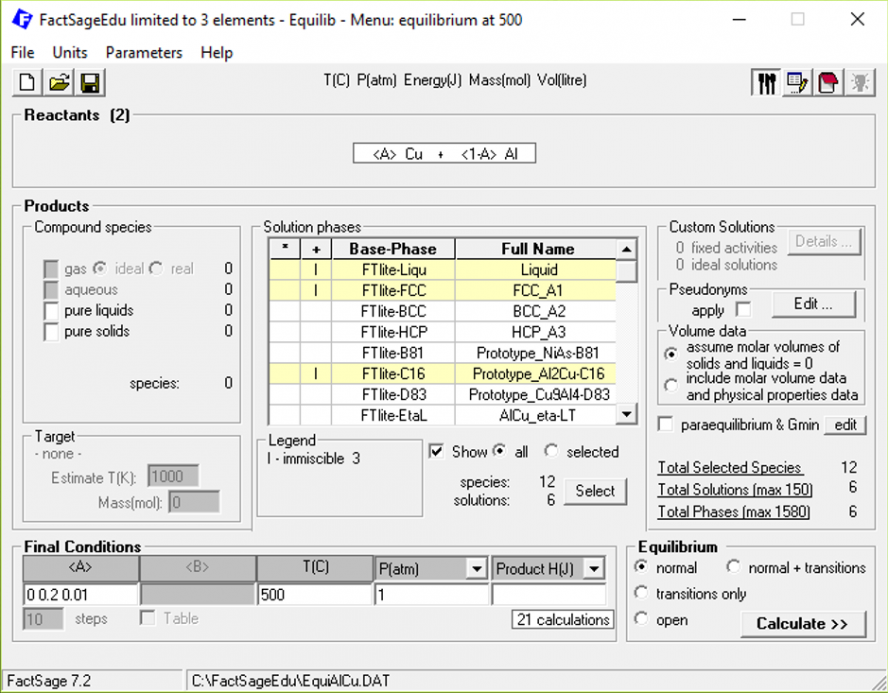
Figure 5
In this case, we are varying < A > from 0 to 0.2 in steps of 0.01, which corresponds to the same concentration range of the phase diagram. Concerning the phases to be calculated, we are considering the Cu-rich FCC phase, the liquid phase and the Al2Cu precipitate. The temperature and pressure were fixed at the desired values. When we press on “Calculate”, and then click on the tab for “A = 0.02”, the following Results window pops up:
![]()
Figure 6
The yellow square shows the stable phases for < A > = 0.2, FCC and Al2Cu, which shows that we are already in the two-phase region of the phase diagram. The blue square shows the chemical composition of the FCC phase, in terms of molar fractions. The green square shows the corresponding composition for the Al2Cu phase.
Notice that the Cu-content of the FCC is XCu = 0.0164 and so the difference between the alloy composition and the necessary minimal Cu-content to form Al2Cu is 0.0164-0.01=0.0064 which answers our original question. In terms of Cu-content we are 0.0064 far from the FCC/FCC+Al2Cu phase boundary.
Now we have already an idea of how far we exactly are from forming Al2Cu. But what is the difference in terms of the activity or of the Gibbs free energy?
This is what we will see in your next blog post of this series…see you!