Constructing a Blast Furnace Diagram with FactSage 8.2
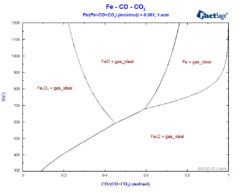
The so-called blast-furnace diagram describes which phases are stable in the different regions of the blast furnace, depending on the conditions of temperature and of the atmosphere inside the furnace[1]. It is basically a phase diagram, where the volume fraction of CO is represented on the X-axis and the temperature is represented on the Y-axis, […]
Constructing a Blast Furnace Diagram with FactSage 8.2 Read More »