João Rezende

From molar Gibbs energy functions to phase diagrams

Al Cu Phase Diagram

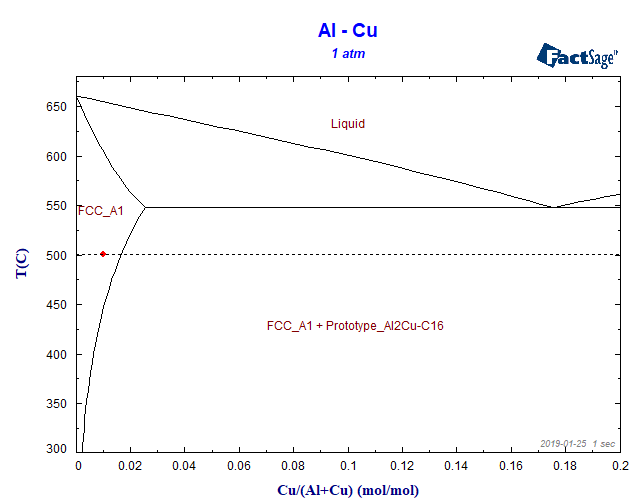
In a series of posts, we will focus on the relation between phase diagrams, Gibbs energy functions and activities. Let us begin with the Al-Cu phase diagram at a temperature of 500 °C. In this blog post we will work exclusively with the FactSage Education Package. Let us suppose we have generated an Al-Cu phase-diagram […]

From molar Gibbs energy functions to phase diagrams Read More »

What is the difference between Fact Pure Substances and SGPS databases?

difference between FactSage and SGPS on the periodic table

I have been asked by a potential customer: “Do I need the Fact Pure Substances or SGTE Pure Substances database?” The answer is: It depends. The two databases are both collections of (normally published) thermochemical data. The Fact Pure Substances database FactPS is maintained by our co-developer of FactSage, Thermfact/CRCT, Polytechnique Montreal. It is generally

What is the difference between Fact Pure Substances and SGPS databases? Read More »

Example for a FactSage calculation of a non-equilibrium process

It is a common misconception that thermodynamic calculations can only be used for processes that are in equilibrium. In fact, there is a lot to learn from an Integrated Thermodynamic Databank System like FactSage even if you are far away from equilibrium! As example we consider the popular Fe-C system: If you choose all phases

Example for a FactSage calculation of a non-equilibrium process Read More »

A hands-on example for a phase-diagram-module calculation

FactSage contains many modules. The major ones for daily work are Equilib and Phase Diagram. Phase Diagram permits the calculation of phase diagram sections for systems with any number of components. Components can be elements, compounds or even arbitrary compositions. For a phase diagram calculation, first the components of interest have to be defined. Then, the possible

A hands-on example for a phase-diagram-module calculation Read More »

A hands-on example for an equilibrium-module calculation

FactSage contains many modules. The major ones for daily work are Equilib and Phase Diagram. In the Equilib module, global Gibbs energy minimization is used to determine the equilibrium state of a complex chemical system defined by its chemical composition, temperature and pressure. Equilib is easy to use: First, the chemical system has to be defined

A hands-on example for an equilibrium-module calculation Read More »

Applications of FactSage in the Energy Research

evolution of number of publications of factsage in the energy area

In the scope of a preparation work for a project proposal, a literature research was conducted on the applications of FactSage in the areas of combustion and gasification of fossil and renewable carbon-containing raw materials. The research included not only the important coal- and biomass-based fuels, but also all kinds of carbon-containing industrial and domestic

Applications of FactSage in the Energy Research Read More »

Casting Case Study: Refractory-melt interactions

Casting with bottom teeming

In the scope of the collaborative research center SFB 761, von Schweinichen(*) experimentally investigated the chemical interactions between a high manganese steel melt and different refractory materials employed in assembling an adequate casting system. Normally, when casting in an open atmosphere, one expects worse results considering cleanliness for a top pouring process (Figure 1) than

Casting Case Study: Refractory-melt interactions Read More »