Including extra data points in FactSage figures
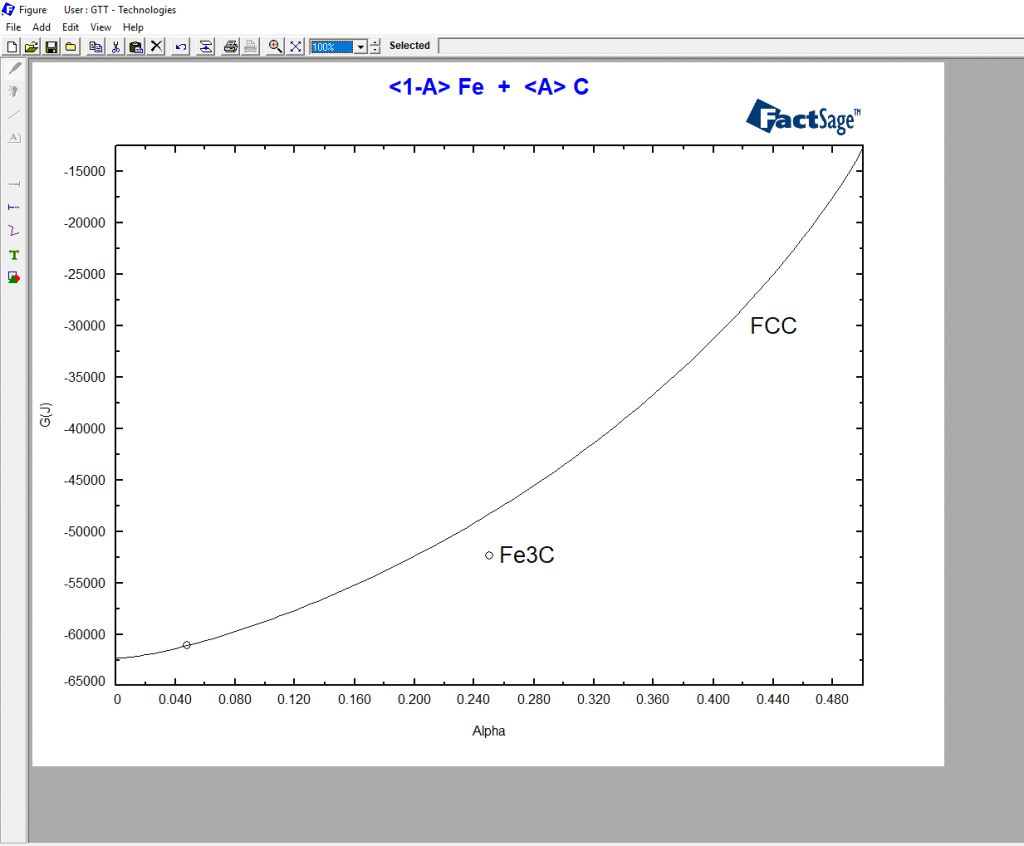
A customer has asked me: “How can I include an experimental point on a figure generated in FactSage ?”. The procedure is relatively simple. Suppose that you have generated a curve in FactSage like the one below. Representing the Molar Gibbs Energy of the γ phase in the Fe-C system at 1000°C as a function […]
Including extra data points in FactSage figures Read More »