Thermochemical modelling of PO-bleachingThe alkaline pressurized hydrogen peroxide stage has been adapted as an efficient method in TCF-bleaching. Though the features of the pressurized PO-stage have been generally observed in the industry, the thermochemistry and reaction kinetics of the process are not yet well understood.
Thermochemical modelling of PO-bleaching
The alkaline pressurized hydrogen peroxide stage has been adapted as an efficient method in TCF-bleaching. Though the features of the pressurized PO-stage have been generally observed in the industry, the thermochemistry and reaction kinetics of the process are not yet well understood.
The present research scheme was designed to provide such thermochemical and kinetic data that the PO-bleaching can be described with physico-chemical models.
INTRODUCTION
The PO-bleaching stage, that is, use of hydrogen peroxide together with pressurized oxygen in alkaline environment has recently been adapted as an efficient method in TCF-bleaching. The enhanced bleaching with the simultaneous use of hydrogen peroxide and oxygen in the alkaline environment is often regarded to be due to increased perhydroxyl (OOH-) ion content in the system which is due to peroxide dissociation and its equilibriation with the alkaline hydroxide /1/. In this study, a thermodynamic multi-component model was constructed for the aqueous H2O2-NaOH-O2 -system. The model was developed by utilizing measured pH-data from the bleaching solution. The hydrogen peroxide was introduced to the model as a metastable substance, which allowed simultaneous calculation of the peroxide dissociation equilibria and oxygen solubility in the alkaline system. The model was used to estimate the initial concentrations of the active ionic species in the bleaching conditions at various temperatures and pressures. In addition, an overall kappa number reduction model was tested for assessment of the PO-reaction kinetics.
THERMOCHEMISTRY OF THE BLEACHING SOLUTION
The thermodynamic model was developed to utilize a multi-component Gibbs energy minimization routine such as Chemsage of Solgasmix /2/. With such a routine, the equilibrium composition of a chemical multi-component system may be calculated together with such intensive quantities as temperature, pressure and pH. For the bleaching solution, the stoichiometry of the aqueous H2O2-NaOH-O2 -system is described in table 1. To allow simultaneous calculation of the dissociation of the metastable (and slightly acidic) hydrogen peroxide and the solubility of oxygen in the system, the calculation technique of image components was used. With this technique, a particular substance can be selected as separate from the rest of the system to allow calculations of metastable equilibria or kinetically constrained systems. The image technique is described in more detail e.g. in /3/.
Here, selecting the gaseous and dissolved oxygen as separate image species, a separate equilibrium solubility can be calculated for oxygen, while the hydrogen peroxide is not allowed to decompose to oxygen and water in the thermodynamic system. The end result is a model for the metastable hydrogen peroxide – oxygen system in the alkaline solution. The image method of calculation is reasonable, as the hydrogen peroxide actually remains metastable in the bleaching solution and its decomposition even at elevated temperatures is relatively slow /4/ . The constituents of the model are given in table 1.
A more comprehensive model should include the effect of possible impurities and stabilizers, but for our purpose their concentrations were considered negligible.
Table 1. The system components used in the thermodynamic model (q denotes the ionic charge in aqueous solution).
Phase Component System-
componentsgas O Na H q H2O 1 0 2 0 H2O2 2 0 2 0 O2 * 2 0 0 0 H2O 1 0 2 0 liquid H2O2 2 0 2 0 O2 * 0 0 0 Na+ 0 1 0 1 OH– 1 0 1 -1 OOH– 2 0 1 -1 H+ 0 0 1 1 solid NaOH 1 1 1 0 The calculation of pH in the solution requires a model for the ionic activity coefficients. In terms of the excess Gibbs energy of the system (Gex), the activity coefficients yield,
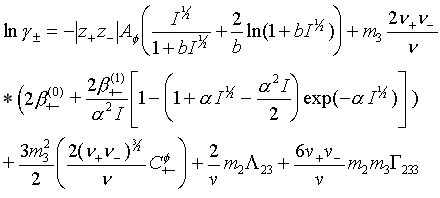
where Yi is activity coefficient of an ion, v is the sum of stoichiometric numbers of the dissociated ions, nw is number of moles of water, Mw is the molar mass of water, T is the temperature, R is gas constant. Index i refers to ionic species. For the Gex the widely used Pitzer’s virial expansion model /5/ for the solute species was applied with such modification which allowed for the interaction between ionic and neutral solute species /6/. With this modification, the mean activity coefficient for an 1-1 electrolyte in water solution is given as follows:
Here
is the ionic strength of the solution. Pitzer defined values for the constants a = 2 (kg/mol) and b = 1.2 (kg/mol) .. Af is the temperature dependent Debye-Hückel parameter and
is the sum of the stoichiometric numbers of the dissociated ions. Index 2 refers to neutral and 3 to ion interaction. Parameters
,
,
are binary ion-ion interaction parameters in the Pitzer equation, L 23 is the binary neutral-ion parameter and G 233 is the ternary neutral-ion-ion parameter. These parameters are temperature and pressure dependent. L 23 can be related to conventional Setschenows salting out/in coefficient k23 /7/ for the dissolved gas.
Gibbs energy minimization routine ChemSageÒ /2/ was used to calculate simultaneuos solubility of oxygen and metastable dissosiation of H2O2 to proton and perhydroxyl anion by denying formation of oxygen from reaction 4.
Thus, metastable equilibria for the H2O2-NaOH-H2O-O2 system could be calculated and then followed with pH-measurements. Calculated and measured pH-values at 22 ° C as a function of H2O2 massfraction are shown in figure 1. Adding Pitzers interaction parameters into stabilized H2O2-system fixes model to measurements. Parameter values for Na+ and OH- are given in literature /8/.
Interaction parameters
,
and
for Na+ and OOH– were fitted to experimental pH data of 0,06 m% NaOH-water solution which was the initial concentration in bleaching experiments, 13.5 (NaOH)g/kg pulp in 5 % consistency.
Further experiments were done with higher concentrations up to 0,3 m% NaOH solutions. Adjusted parameter values were kept constant and more concentrated solutions were calculated. pH values obtained by the model follow the experimental data at least concentrations between 0,03m%-0,3m% (0,0075M-0,075M) NaOH- and 0M-0,2M H2O2-concentrations. Thus, the chosen modeling technique seems to be viable to predict the thermochemical properties of the bleaching solution. To obtain a critical assesment for the values of interaction parameters
,
and
more experiments should yet be done and a rigorous parameter fitting procedure should be applied.
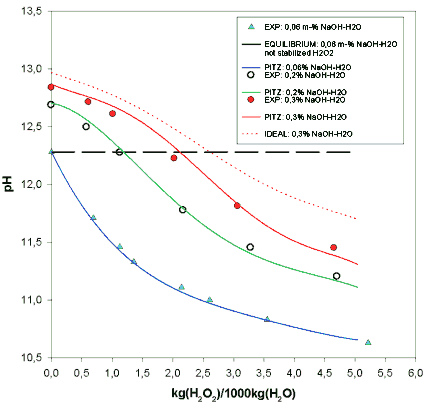
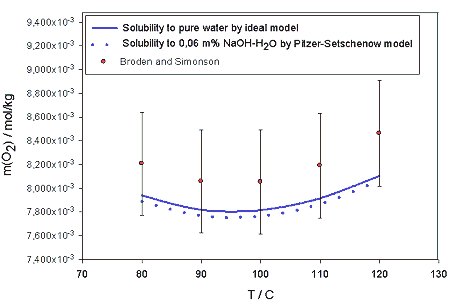
Figure 1. pH as a function of H2O2 massfraction for NaOH-H2O2-H2O-O2 system at 22°C temperature.As the parameters are temperature and pressure dependent it is possible to extend the model for estimation of the properties of the system at their values in the process conditions. In this work, the model was used to estimate the solubility of oxygen, of which also experimental data in terms of temperature, pressure and alkali concentration is found. In figure 2., the solubility of oxygen at temperatures between 80 and 120 ° C are shown. The minimum found near 100° C corresponds to the experimental findings of Broden and Simonson /9/.
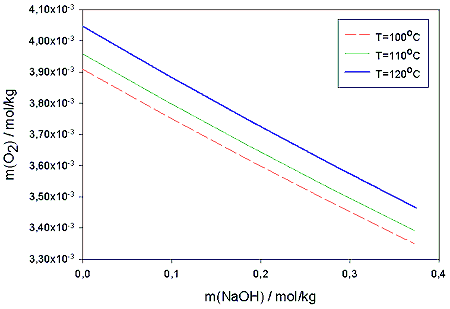
Figure 2. Calculated solubilities of oxygen in to pure water and 0,06 m% NaOH solution as a function of temperature in 10 bar partial pressure of oxygen. Calculations are compared to experimental value obtained by Broden and Simonson /9/.In table 2. the model values of the oxygen solubility are compared to those obtained for pure water by Henry’s law. The slight salting out -effect of NaOH is clearly seen. In figure 3. the effect is shown for the temperatures 100, 110 and 120 °C.
T=22°C Henry’s
law0,06m%
NaOH
Pitzer-
Sets.0,30m%
NaOH
Pitzer-
Sets.1m % NaOH
Pitzer-
Sets.P(O2)/
barm(O2)/
mmol/kgm(O2)/
mmol/kgm(O2)/
mmol/kgm(O2)/
mmol/kg1
1,328
1,320
1,287
1,197
2,5
3,321
3,300
3,219
2,994
3
3,985
3,960
3,863
3,593
5
6,642
6,601
6,439
5,988
7
9,298
9,240
9,013
8,383
10
13,283
13,201
12,876
11,975
Table 2. Solubility of oxygen in NaOH-solutions as a function of its partial pressure at 22° C temperature; calculated values from Pitzer-Setschenow model by minimizing Gibbs free energy.
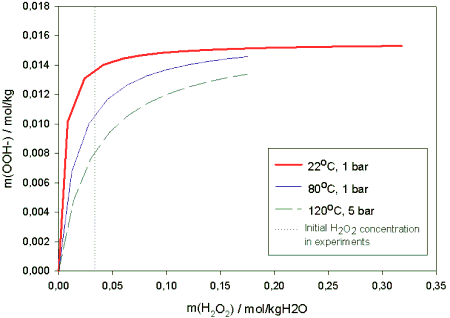
Figure 3. Solubility of oxygen obtained from Pitzer-Setschenow model as a function of NaOH molality in 100, 110 and 120°C temperatures and 5 bar partial pressure of oxygen.The multi-component model could as well be used to estimate the ionic concentrations as function of temperature and pressure. The model suggests that the equilibrium value of the OOH- -ion tends to decrease somewhat with increasing temperature. Pressure has no effect on the equilibrium concentrations in the range 2-15 bar. The curves obtained for the molality of OOH- as function of temperature are shown in figure 4. Though the initial amount of the perhydroxyl anion decreases with ca. 20 % between 80 °C and 120 °C it is not likely that this drop would have notable effects on the subsequent peroxide reaction kinetics.
Figure 4. Model prediction of OOH- -concentration with 0.06 m% NaOH -feed.
EFFECTS OF TEMPERATURE AND PRESSURE ON THE REACTION RATESThe kinetics of the PO-bleaching process was studied by a series of bleaching experiments. In these experiments, the peroxide consumption, alkali concentration, pH as well as the pulp qualities were determined at different temperatures and pressures as function of the reaction time.The experiments were performed with 25 g kraft pulp samples at pulp consistency of ca 5 % and with initial k-number 10-13. The metal impurities were kept low with DTPA-chelating. The testing was done in a Parr 4522 autoclave (2000 cm3) with all internal parts teflon-lined. The detailed setup as well as the sampling procedure have been explained earlier /4/. In the kinetic experiments, particularly the effects of temperature and pressure were followed in the course of the reaction time and thus the chemical feeds were kept constant. The peroxide feed was 25 g/kg pulp and NaOH 13.5 g/kg pulp. The initial pH of the pulp mixture was ca. 11.2 (measured at ambient temperature). The duration of an entire bleacing test run was ca 120 min. The reproducibility of the experiments with different pulp samples was good /10/.
The effect of temperature on the bleaching reactions was followed at 95-120 °C. With increasing temperature, the rate of consumption of H2O2 and NaOH increases, the pH of the solution decreases more fast and, as the bleaching results improved brightness and a lower k-value are reached with less retention time. Respectively, the viscosity loss is then somewhat higher /10/.
In our experiments with all internal surfaces of the experimental equipment teflon-lined, the residual peroxide remained at 40-50 % of the feed after 120 min test runs. As the k-reduction also levels out in this time, we concluded that the peroxide concentration reaches a residual level in the pure (chelated) system and decomposes but slowly in the absence of transition metal catalysts and respective surface sites. The alkali catalysed decomposition also becomes slow in the end due to decrease of pH as result of the bleaching process. Further, there seems to be no such organic product of the bleaching reactions, which would cause continued peroxide consumption in the solution.
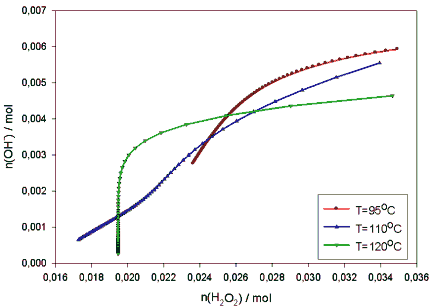
Instead, one may notice that the pH continually decreases in the high temperature (120 °C) experiments /4,10/ and, respectively alkali is consumed. In figure 5 the alkali consumption vs. the peroxide consumption in our experiments of 95, 110 and 120 °C are outlined. It is interesting to note the change of pattern of the alkali consumption at 120 °C. The interdependence of these two constituents is distinctively different at this temperature than at the two lower temperatures and even when H2O2 remains relatively stable, the amount of alkali continues to decrease steadily.
Figure 5. The observed alkali consumption vs. peroxide consumption in the PO-bleaching experiments (P(O2) = 5 bar, k (initial) = 9,6.The pressure effects were studied with the above temperatures (95-120 °C) at 1 – 12 bars partial pressure of oxygen. At any constant temperature the pressure has no effect on the rate of the peroxide decomposition /4/, nor is there any notorious effect of pressure on the rates of the cemical consumption in the bleaching reactions. A slight increase of k -reduction and, more evidently, a somewhat improved brightness is achieved in 120 min with increasing pressure at constant temperature /4/.
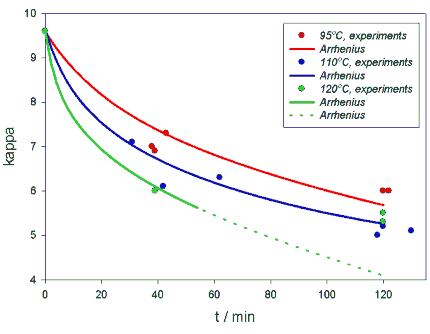
MODEL FOR THE OVERALL KAPPA RATEOn the basis of the experiments, an Arrhenius model for the overall consumption of H2O2 and for the reduction of kappa-number was developed. The model was based on measurements of H2O2 and NaOH consumption and kappa number during the bleaching reaction. Reactions were done in 95oC, 110oC and 120oC temperatures. From measurements reaction rate equation for k -reduction was developed. Reaction rate parameters for k , [H2O2] and [OH-] were fixed to be temperature independent and reaction rate constant k was calculated for each temperature.For kappa number we have:From data obtained from experiments is presented in table 3.
95° C 110° C 120° C t/min kappa t/min kappa t/min kappa 0 9.6 0 9.6 0 9.6 38 7 31 7.1 39 6 39 6.9 42 6.1 120 5.5 43 7.3 62 6.3 120 5.3 120 6 118 5 122 6 120 5.2 130 5.1 Table 3. Kappa-numbers obtained from experiments at 5 bar partial pressure of oxygen.
A non linear Levenberg-Marguardt algorithm was used to define values for the parameters k, a, b and g. The values obtained for a, b and g are given in table 4 with comparison of the values of Moldenius for the (un-pressurized) H2O2 bleaching reaction /11/.
(alpha) (beta) (gama) This Work 2.2 1.8 0.2 Moldenius 2.2 0.67 0.22 Table 4. Reaction rate parameters for k-reduction
Figure 6. The Arrhenius plot of lnk against 1/T for the degrease of kappa-number and the best straight line. The slope gives -Ea/R and intersept at 1/T=0 gives lnA. Ea=64334 J/mol and A/A°=86804
Figure 7. Arrhenius model calculated from equation 5 and experiments for kappa at 95°C, 110° C and 120°C and 5 bar partial pressure of oxygen.DISCUSSIONObviously, the PO-stage combines the advantages of the alkaline oxygen bleaching and peroxide treatment. The reaction dynamics involves both the dissolved oxygen and the stabilized hydrogen peroxide as active species and thus the phenomena of PO-bleaching can be better understood through the thermochemistry of the alkaline hydrogen peroxide solutions. The enhanced bleaching of the simultaneous use of hydrogen peroxide and oxygen in the alkaline environment is often regarded to be due to increased perhydroxyl (OOH-) ion content in the system. The yet tentative thermodynamic model presented in this study predicts that the equilibrium concentration of OOH- decreases slightly with increasing temperature. However, as the reaction rates are increased with temperature in the normal Arrhenius fashion, it is likely that this has little effect on the actual bleaching process. However, this suggests that when operating at high temperatures, it is beneficial to maintain a reasonably high level of residual peroxide.
The only notorious effect that increasing pressure has on the process parameters in the (Henrian) increase of oxygen solubility which may also be shown with the thermodynamic model. When both the experimental and modeling observations of the PO-bleaching are considered, one finds that the increased temperature has major effects on reaction rates as well as on the reaction times to reach desired bleaching results. Pressurizing, in the first part, allows for the operation at temperatures around 100 °C. As the pressure merely affects the solubility of oxygen in the system and not noticeably on the reaction kinetics, one is tempted to the conclusion that the improved bleaching results (brightness) in higher pressures is due to the increased solubility and enhanced mass transfer of oxygen in such conditions. This is in fact in accordance with the findings of the effects of oxygen pressure in the oxygen delignification processes /1, p. 233/.
REFERENCES:
Dence, C.V. and Reeve, D.W.: Pulp Bleaching, Principles and Practice, TAPPI Press, Atlanta, Georgia 1996
Hack, K. (editor): The SGTE Casebook: Thermodynamics at Work, 118-128, The Institute of Materials, Bournemouth, 1996
Koukkari P., Laukkanen I. and Liukkonen S.: Combination of overall Reaction rate with Gibbs energy minimization, Fluid Phase Eq. (in press)
Koukkari P. and Salminen J.: Thermochemistry and reaction kinetics of PO-Bleaching, 9th ISWPC, Montreal, Canada 9.-12.6. 1997., 50/1-5
Pitzer, K., S., Thermodynamics of electrolytes. 1. Theoretical basis and general equations, J. Phys. Chem, 77 (1973) No 2, 268-277
Salminen J., Solubilities of gases in water solutions, Master’s thesis, Helsinki University of Technology, 1997 (In Finnish)
Corti H., Pablo J. and Prausnitz J., Phase equilibria for aqueous systems containing salts and carbon dioxide. Application of Pitzer’s theory for electrolyte solutions, J. Phys. Chem., 94 (1990) 7876-7880
&nbnsp;
Harvie C., Moller N. and Weare J., The prediction of mineral solubilities in natural waters: The Na-K-Mg-Ca-H-Cl-SO4-OH-HCO3-CO3-CO2-H2O system to high ionic strengths at 25°C, Geochim. Cosmochim. Acta, 48 (1984) 723-751Broden A and Simonson R.: Solubility of Oxygen, Part 2, Svensk Papperstidning No 16, 1979, 487-491
Salminen J. and Koukkari P.: Temperature and pressure effects in peroxide bleaching, Kemia ’97, Helsinki 11.-13.11. 1997
Qian X. and Tessier P.: Dynamic modeling and control of a hydrogen peroxide bleaching process, Pulp & Paper Canada 98:9 (1997), T340-T344
Lachenal, D., Cardona, D., Chirat, C.: Fundamentals of extended oxygen bleaching, 9th ISWPC, Montreal, Canada 9.-12.6. 1997, D1-1-D1-5


