FactSage

GTT-Technologies at CALPHAD 2024

The International Conference on Computer Coupling of Phase Diagrams and Thermochemistry CALPHAD took place from 26 to 31 May in Mannheim, Germany. Of course, we at GTT didn’t want to miss out! GTT-Technologies CEO Moritz to Baben and software expert Florian Tang, together with Bengt Hallstedt from RWTH Aachen University, organised the pre-conference workshop “Software tools […]

GTT-Technologies at CALPHAD 2024 Read More »

Constructing a Blast Furnace Diagram with FactSage – Part IV

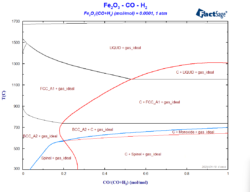
In order to reduce the CO2 emissions caused by the iron & steel industry, there have been initiatives in the last decades to substitute reductants based on carbon by the use of H2 as a reducing agent. These initiatives go from the direct injection of H2 at the tuyeres of the blast furnace [1, 2]

Constructing a Blast Furnace Diagram with FactSage – Part IV Read More »

Constructing a Blast Furnace Diagram with FactSage – Part III

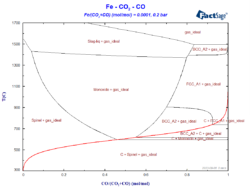
In the 3rd blog post of this series related to the Blast Furnace Diagram, we at first consider the effect of including the metallic phases as solution phases instead of considering them as pure compounds, like we already did for the oxides. Then, we show how the total pressure will affect the diagram, in special

Constructing a Blast Furnace Diagram with FactSage – Part III Read More »

Constructing a Blast Furnace Diagram with FactSage – Part II

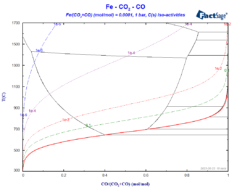
In the second blog post of this series related to the Blast Furnace Diagram, we explore some variations of the diagram constructed in the first blog post, while sticking to carbon as the only reducing agent in the system. This blog post was written in collaboration with Klaus Hack. The first diagram that we will

Constructing a Blast Furnace Diagram with FactSage – Part II Read More »

How to create a private database in FactSage – A recipe

FactSage databases constitute the largest set of evaluated and optimized thermodynamic databases for inorganic systems in the world [1]. However, in case your system of interest is not (fully) covered by commercial databases, the development of own, i.e. private, databases might be required. This blogpost outlines how you can create a private database in FactSage

How to create a private database in FactSage – A recipe Read More »

Constructing a Blast Furnace Diagram with FactSage 8.2

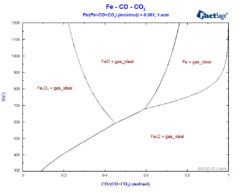
The so-called blast-furnace diagram describes which phases are stable in the different regions of the blast furnace, depending on the conditions of temperature and of the atmosphere inside the furnace[1]. It is basically a phase diagram, where the volume fraction of CO is represented on the X-axis and the temperature is represented on the Y-axis,

Constructing a Blast Furnace Diagram with FactSage 8.2 Read More »

Calphad Optimizer

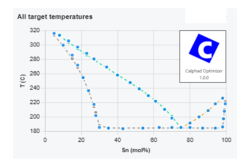
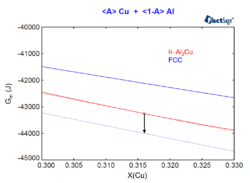
The latest FactSage release, FactSage 8.2, comprises a completely new tool to facilitate the development of thermodynamic databases based on the Calphad methodology – the Calphad Optimizer (Figure 1). Figure 1: The new Calphad Optimizer in FactSage 8.2. The goal of database development is to derive a set of self-consistent thermochemical parameters that allow the

Calphad Optimizer Read More »

FactSage 8.2 release

We are happy to inform you that the most recent update of FactSage, version 8.2, has recently been delivered to our customers. In this version, we improved the capability of some important calculation modules and also introduced a new app for the assessment of Gibbs energy functions! Many of the standard databases have been significantly

FactSage 8.2 release Read More »