Equilib Module

Constructing a Blast Furnace Diagram with FactSage – Part IV

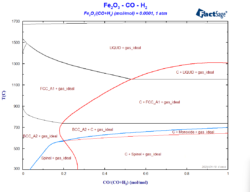
In order to reduce the CO2 emissions caused by the iron & steel industry, there have been initiatives in the last decades to substitute reductants based on carbon by the use of H2 as a reducing agent. These initiatives go from the direct injection of H2 at the tuyeres of the blast furnace [1, 2] […]

Constructing a Blast Furnace Diagram with FactSage – Part IV Read More »

From molar Gibbs energy functions to phase diagrams

Al Cu Phase Diagram

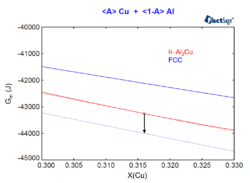
In a series of posts, we will focus on the relation between phase diagrams, Gibbs energy functions and activities. Let us begin with the Al-Cu phase diagram at a temperature of 500 °C. In this blog post we will work exclusively with the FactSage Education Package. Let us suppose we have generated an Al-Cu phase-diagram

From molar Gibbs energy functions to phase diagrams Read More »

A hands-on example for an equilibrium-module calculation

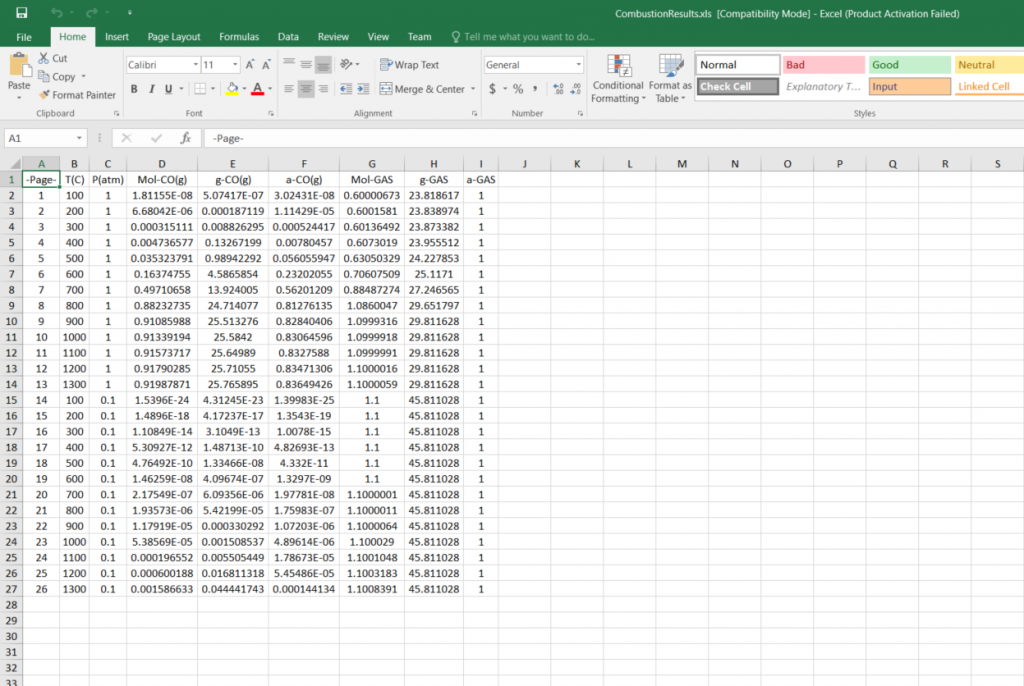
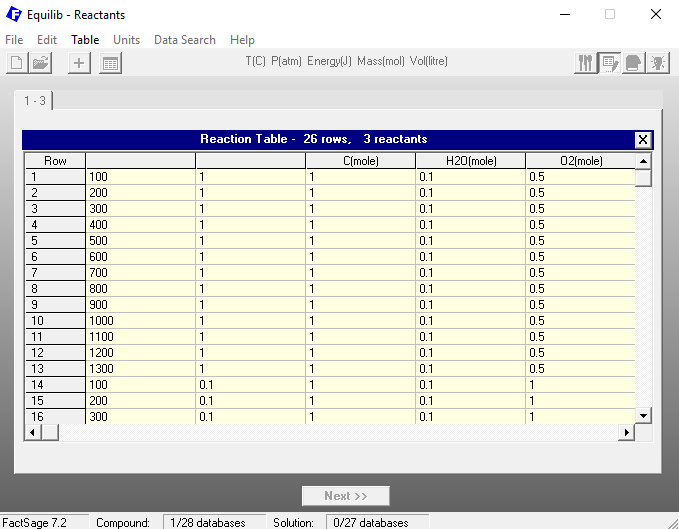
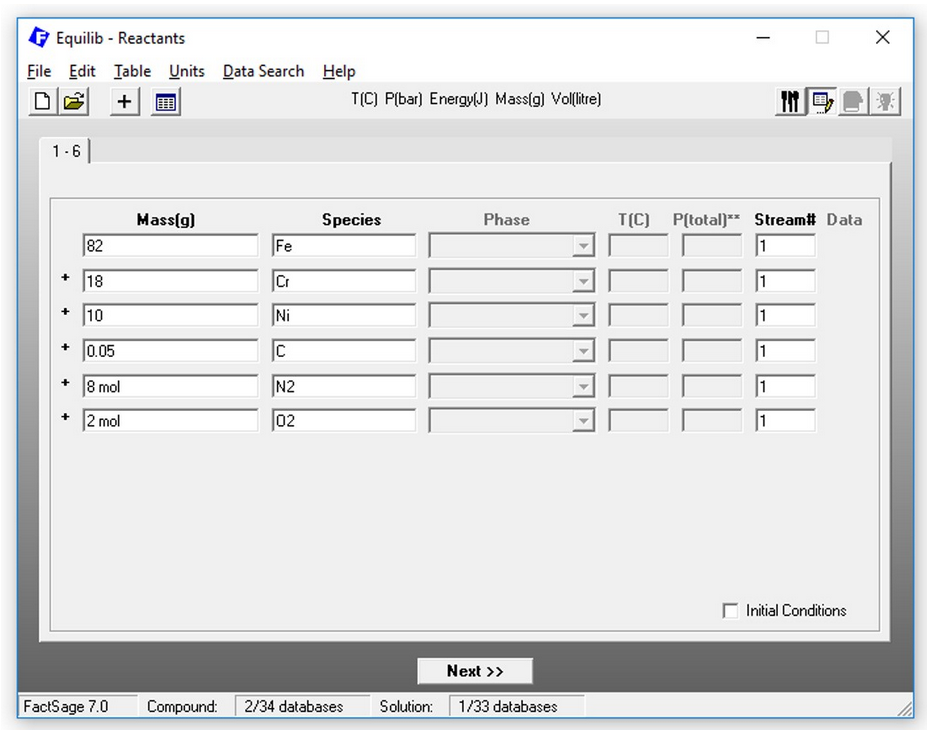
FactSage contains many modules. The major ones for daily work are Equilib and Phase Diagram. In the Equilib module, global Gibbs energy minimization is used to determine the equilibrium state of a complex chemical system defined by its chemical composition, temperature and pressure. Equilib is easy to use: First, the chemical system has to be defined

A hands-on example for an equilibrium-module calculation Read More »

Casting Case Study: Refractory-melt interactions

Casting with bottom teeming

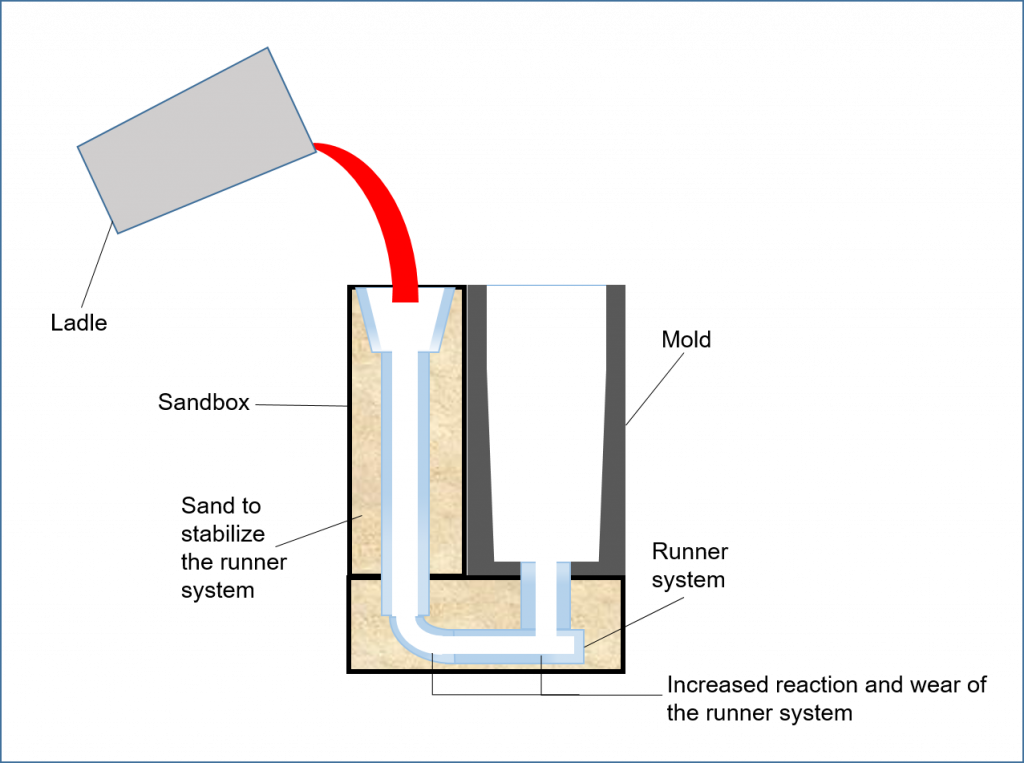
In the scope of the collaborative research center SFB 761, von Schweinichen(*) experimentally investigated the chemical interactions between a high manganese steel melt and different refractory materials employed in assembling an adequate casting system. Normally, when casting in an open atmosphere, one expects worse results considering cleanliness for a top pouring process (Figure 1) than

Casting Case Study: Refractory-melt interactions Read More »