Sustainability

Process simulation for decarbonization

We are excited to announce the commencement of our “Process Simulation for Decarbonization” project, funded by the European Union and the state of NRW. This initiative aims to enhance our capabilities in modeling mass transport, heat transfer, and reaction kinetics, all essential for predicting complex chemical processes. In keeping with the European spirit, our transformation […]

Process simulation for decarbonization Read More »

Navigating the chemical space: Sustainable metallurgy through materials informatics

How can we accelerate the transformation of the iron and steel industry using materials informatics? Computational thermochemistry is fundamental for the transition to sustainable metallurgy. You need to understand thermodynamics to create process models – or to discover new alloy compositions for advanced engineering applications. We face challenges such as the decarbonization of steel metallurgy

Navigating the chemical space: Sustainable metallurgy through materials informatics Read More »

Constructing a Blast Furnace Diagram with FactSage – Part IV

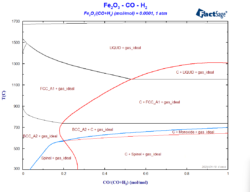
In order to reduce the CO2 emissions caused by the iron & steel industry, there have been initiatives in the last decades to substitute reductants based on carbon by the use of H2 as a reducing agent. These initiatives go from the direct injection of H2 at the tuyeres of the blast furnace [1, 2]

Constructing a Blast Furnace Diagram with FactSage – Part IV Read More »

Constructing a Blast Furnace Diagram with FactSage – Part III

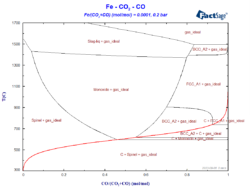
In the 3rd blog post of this series related to the Blast Furnace Diagram, we at first consider the effect of including the metallic phases as solution phases instead of considering them as pure compounds, like we already did for the oxides. Then, we show how the total pressure will affect the diagram, in special

Constructing a Blast Furnace Diagram with FactSage – Part III Read More »

Constructing a Blast Furnace Diagram with FactSage – Part II

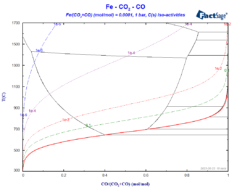
In the second blog post of this series related to the Blast Furnace Diagram, we explore some variations of the diagram constructed in the first blog post, while sticking to carbon as the only reducing agent in the system. This blog post was written in collaboration with Klaus Hack. The first diagram that we will

Constructing a Blast Furnace Diagram with FactSage – Part II Read More »

Constructing a Blast Furnace Diagram with FactSage 8.2

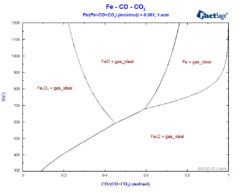
The so-called blast-furnace diagram describes which phases are stable in the different regions of the blast furnace, depending on the conditions of temperature and of the atmosphere inside the furnace[1]. It is basically a phase diagram, where the volume fraction of CO is represented on the X-axis and the temperature is represented on the Y-axis,

Constructing a Blast Furnace Diagram with FactSage 8.2 Read More »