How-to

Automated input and output in FactSage – Part I

Tabular input for automated calculation with FactSage.

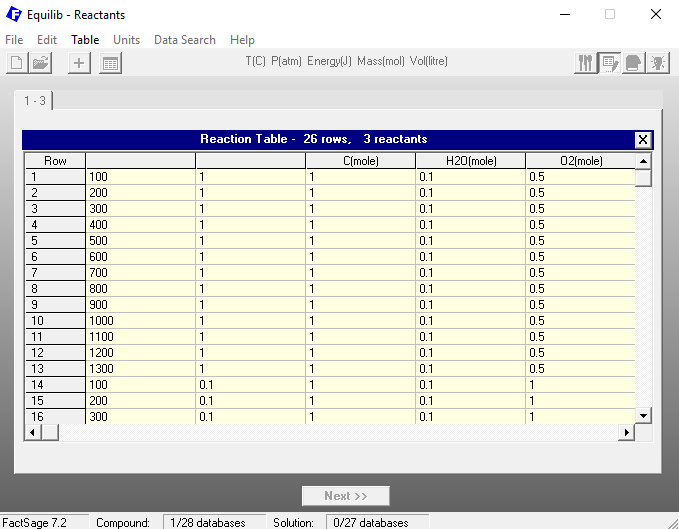
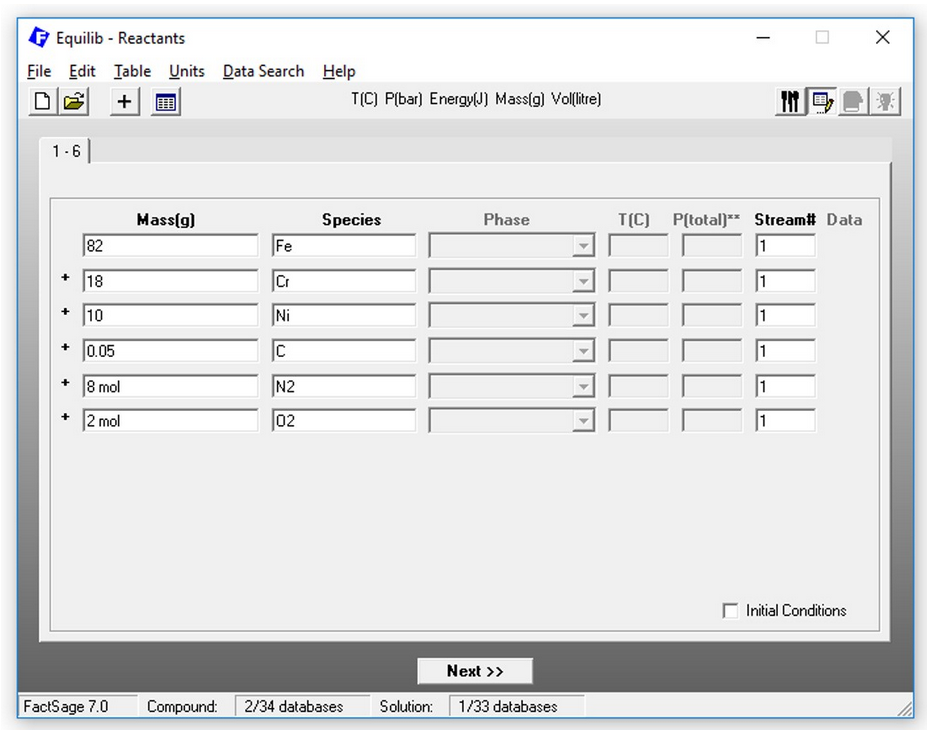
A customer has asked me: “Is it possible to export/import data to and from FactSage? For instance, I would like to do a series of calculations for different initial chemical compositions of the system and it would be very useful to import all the compositions automatically from an Excel table into FactSage”. Yes, it is […]

Automated input and output in FactSage – Part I Read More »

From molar Gibbs energy functions to phase diagrams

Al Cu Phase Diagram

In a series of posts, we will focus on the relation between phase diagrams, Gibbs energy functions and activities. Let us begin with the Al-Cu phase diagram at a temperature of 500 °C. In this blog post we will work exclusively with the FactSage Education Package. Let us suppose we have generated an Al-Cu phase-diagram

From molar Gibbs energy functions to phase diagrams Read More »

Example for a FactSage calculation of a non-equilibrium process

It is a common misconception that thermodynamic calculations can only be used for processes that are in equilibrium. In fact, there is a lot to learn from an Integrated Thermodynamic Databank System like FactSage even if you are far away from equilibrium! As example we consider the popular Fe-C system: If you choose all phases

Example for a FactSage calculation of a non-equilibrium process Read More »

A hands-on example for a phase-diagram-module calculation

FactSage contains many modules. The major ones for daily work are Equilib and Phase Diagram. Phase Diagram permits the calculation of phase diagram sections for systems with any number of components. Components can be elements, compounds or even arbitrary compositions. For a phase diagram calculation, first the components of interest have to be defined. Then, the possible

A hands-on example for a phase-diagram-module calculation Read More »

A hands-on example for an equilibrium-module calculation

FactSage contains many modules. The major ones for daily work are Equilib and Phase Diagram. In the Equilib module, global Gibbs energy minimization is used to determine the equilibrium state of a complex chemical system defined by its chemical composition, temperature and pressure. Equilib is easy to use: First, the chemical system has to be defined

A hands-on example for an equilibrium-module calculation Read More »