ChemSheet and ChemSheet Light come with a set of Microsoft Excel files containing simulation examples. This helps you to get to know ChemSheet better by seeing how the different example cases have been done. The included thermodynamic data files enable you to do your models, even if you do not already have specific thermodynamic data-files for your particular application.
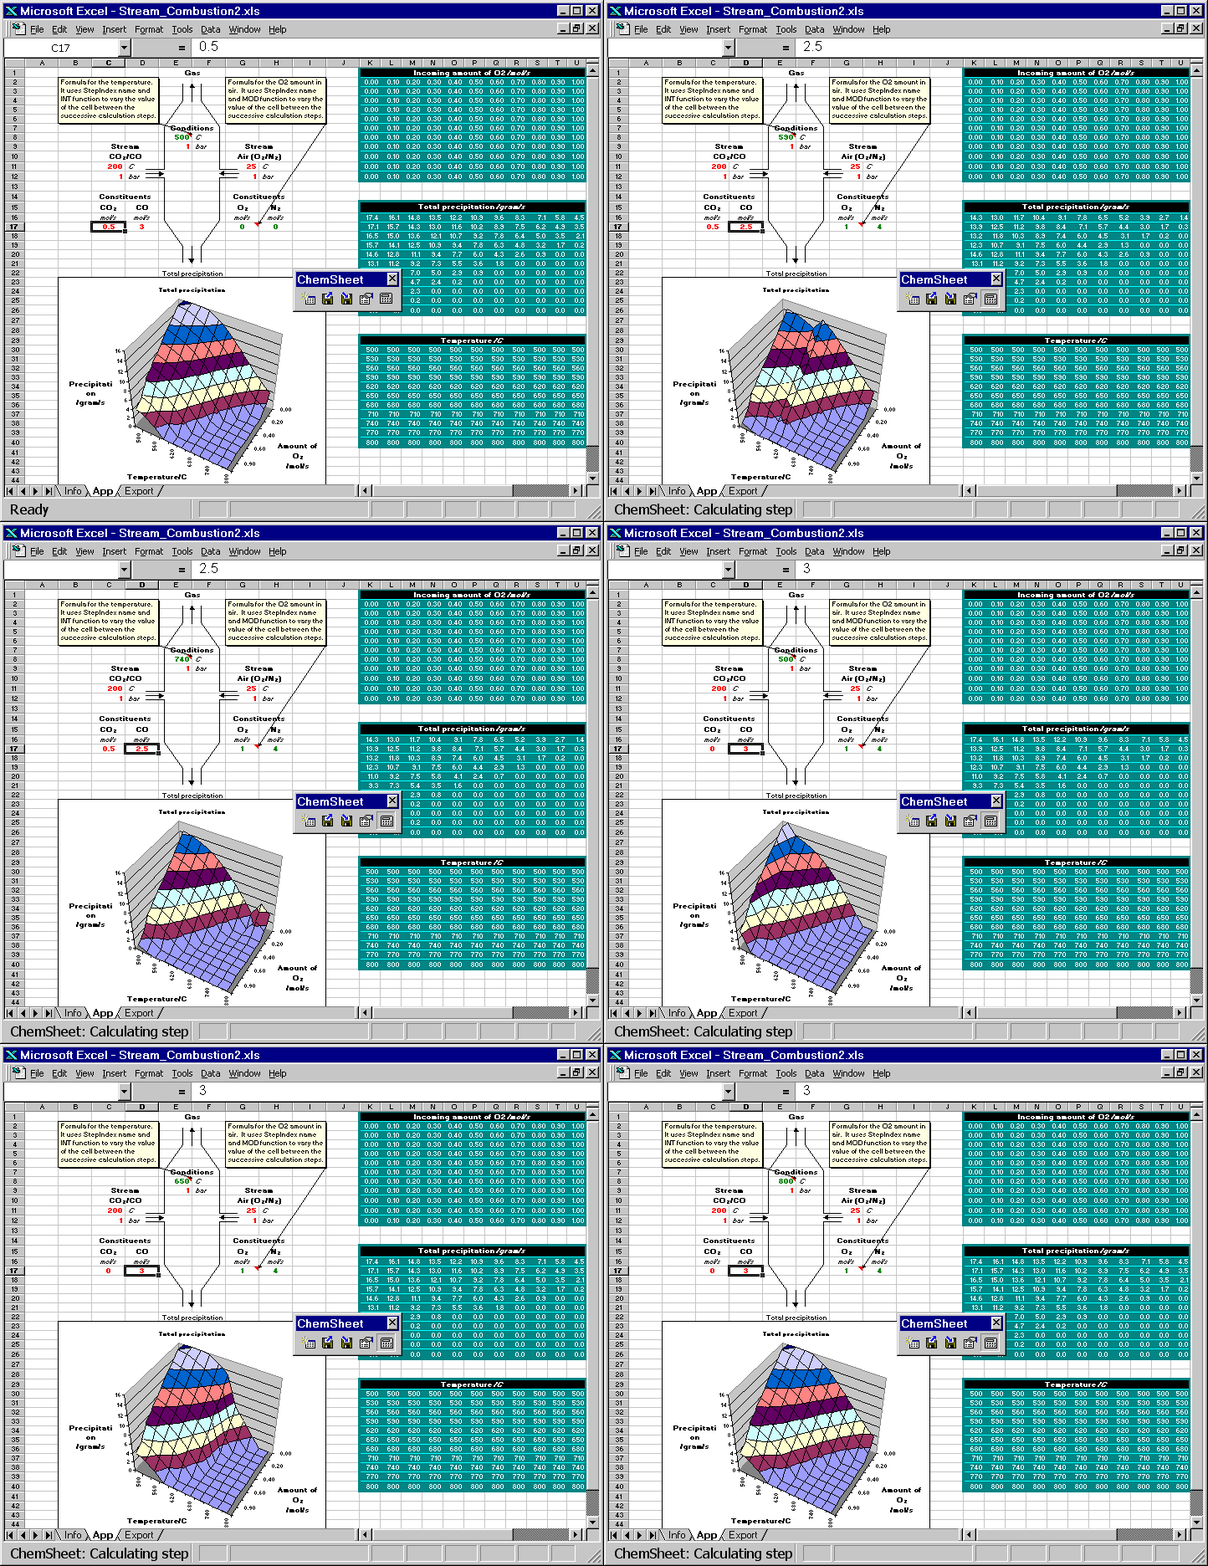
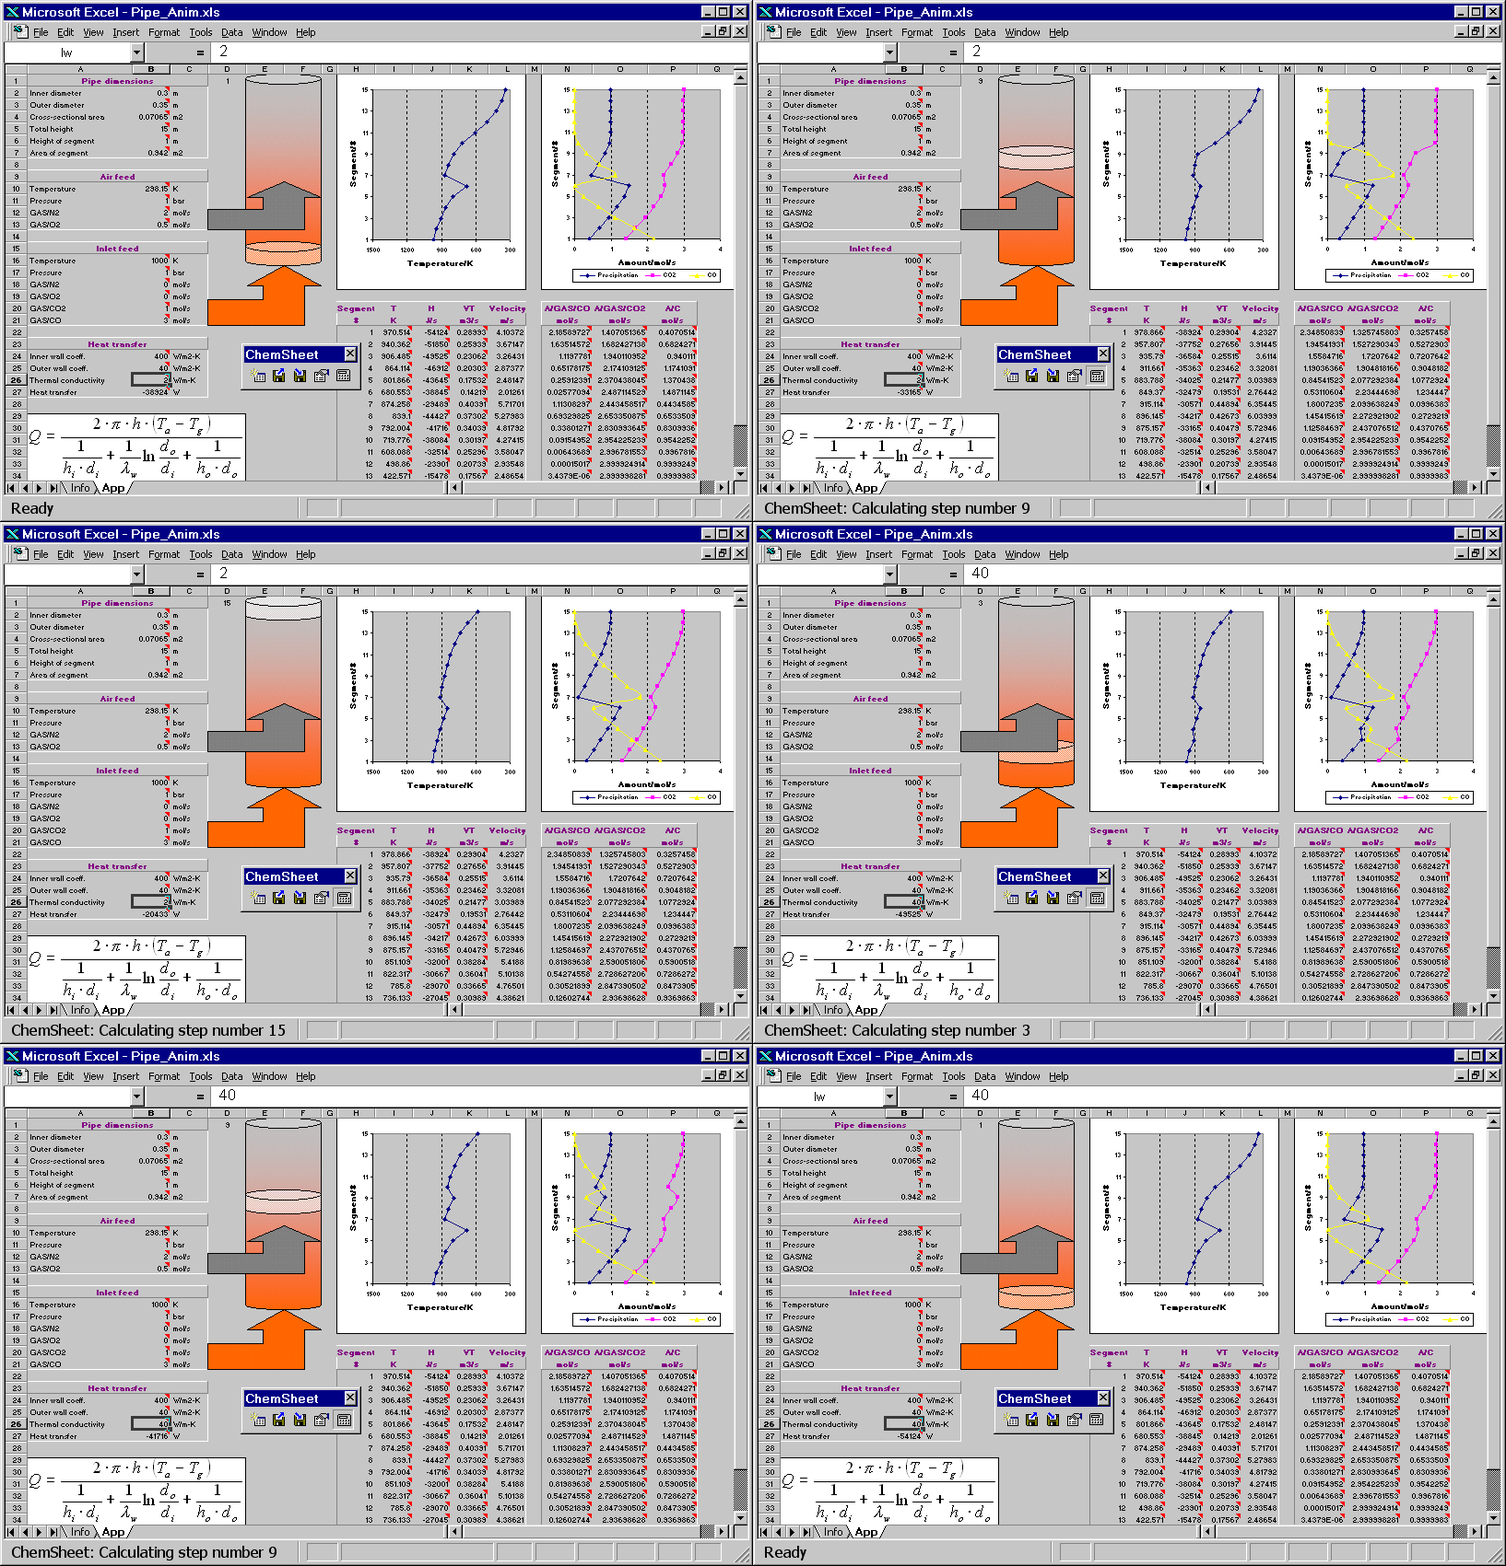
Here are two animated gif files that show ChemSheet calculations with two different kinds of applications. In both examples a combustion process is simulated using the system C-N-O. While the chemical system itself is very simple, it provides a good basis for demonstration. Attention will be paid to the conditions leading to the formation of condensed phases, i.e. precipitates formed during the combustion or cooling. With the simple data-file used here, the only possible precipitate is solid carbon. Both examples are distributed with ChemSheet.

Both the combustion temperature and the amounts of the constituents of the stream Air are varied such that the result is a 3D-chart of the soot formation (precipitated solid carbon). First the model is calculated with certain constant values for CO and CO2 in CO/CO2 stream. Then they are changed so that the total amount of carbon is constant but the amount of oxygen is increased or decreased. You can see how that affects the amount of the precipitated solid carbon.

The hot combustion gas (Inlet feed stream) enters the bottom of a vertical pipe. As the gas volume element moves upwards in the pipe it exchanges heat with the ambient air through the pipe wall. Another stream (Air feed) is fed higher up into the pipe. The resulting combustion leads to an in crease of the temperature of the gas. Further up in the pipe the temperature drops again due to heat losses. The reciprocal of an overall heat transfer coefficient can be considered to be an overall heat resistance composed of three resistances in series: the resistance of the gas inside the pipe, the resistance of the wall, and the resistance of the ambient air. Heat transfer coefficients generally depend on several influences but for simplicity they are given as constants in the present example. First the model is calculated with a certain value for the thermal conductivity of the pipe wall. Then the conductivity is changed and as a result the temperature profile of the gas volume element changes. You can see how the change in the temperature affects the amount of the precipitated solid carbon, CO and CO2.
