FactSage

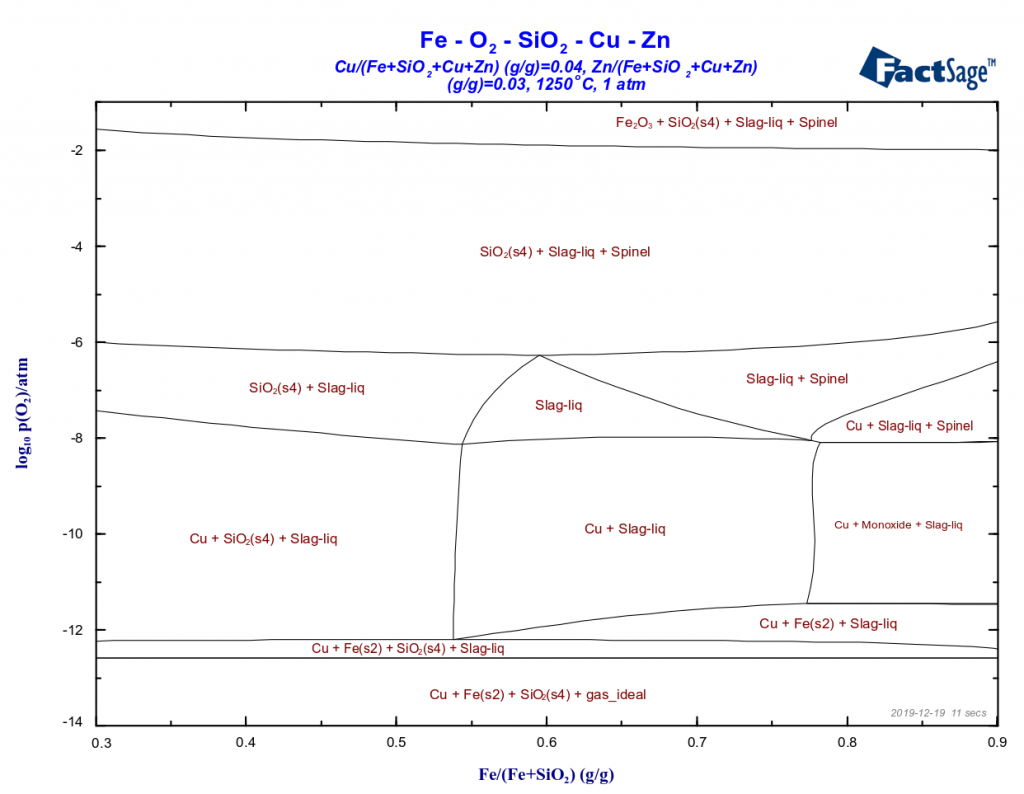
Minimization of copper losses to the converter slag through a boron oxide addition

The loss of copper in the converting process through its incorporation to the converter slag represents a major problem in the copper metallurgy. There are two important mechanisms for this phenomenon: the physicochemical and the mechanical one. The mechanical mechanism, i.e. the mechanical entrapment of matte or of metallic copper inside the slag, is by

Minimization of copper losses to the converter slag through a boron oxide addition Read More »

From molar Gibbs energy functions to phase diagrams

Al Cu Phase Diagram

In a series of posts, we will focus on the relation between phase diagrams, Gibbs energy functions and activities. Let us begin with the Al-Cu phase diagram at a temperature of 500 °C. In this blog post we will work exclusively with the FactSage Education Package. Let us suppose we have generated an Al-Cu phase-diagram

From molar Gibbs energy functions to phase diagrams Read More »

What is the difference between Fact Pure Substances and SGPS databases?

difference between FactSage and SGPS on the periodic table

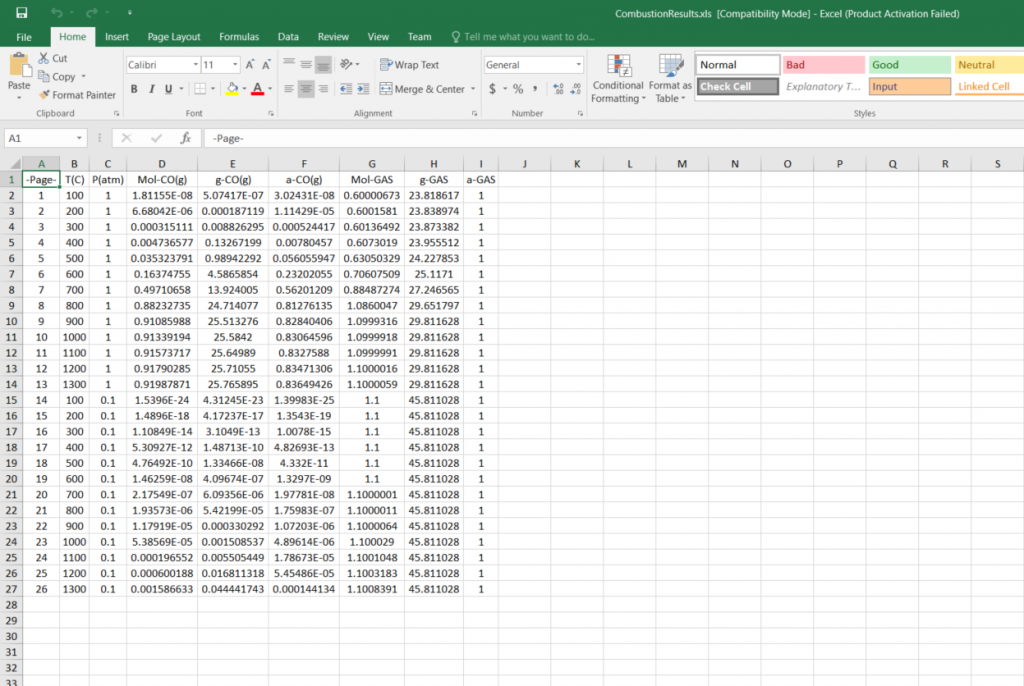
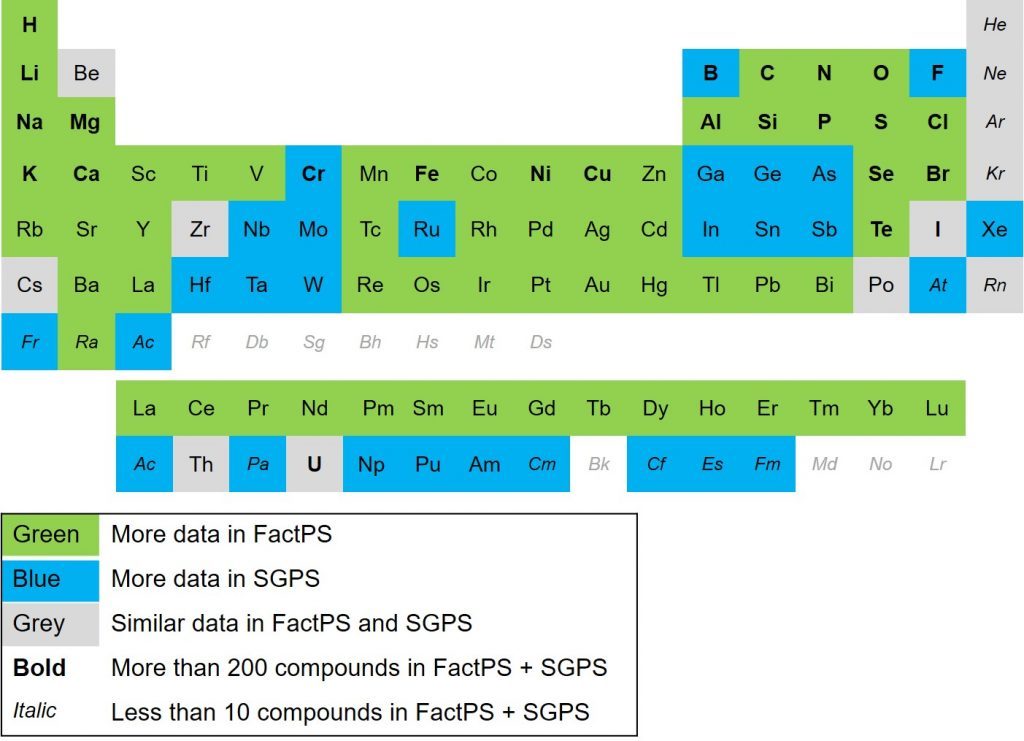
I have been asked by a potential customer: “Do I need the Fact Pure Substances or SGTE Pure Substances database?” The answer is: It depends. The two databases are both collections of (normally published) thermochemical data. The Fact Pure Substances database FactPS is maintained by our co-developer of FactSage, Thermfact/CRCT, Polytechnique Montreal. It is generally

What is the difference between Fact Pure Substances and SGPS databases? Read More »

Example for a FactSage calculation of a non-equilibrium process

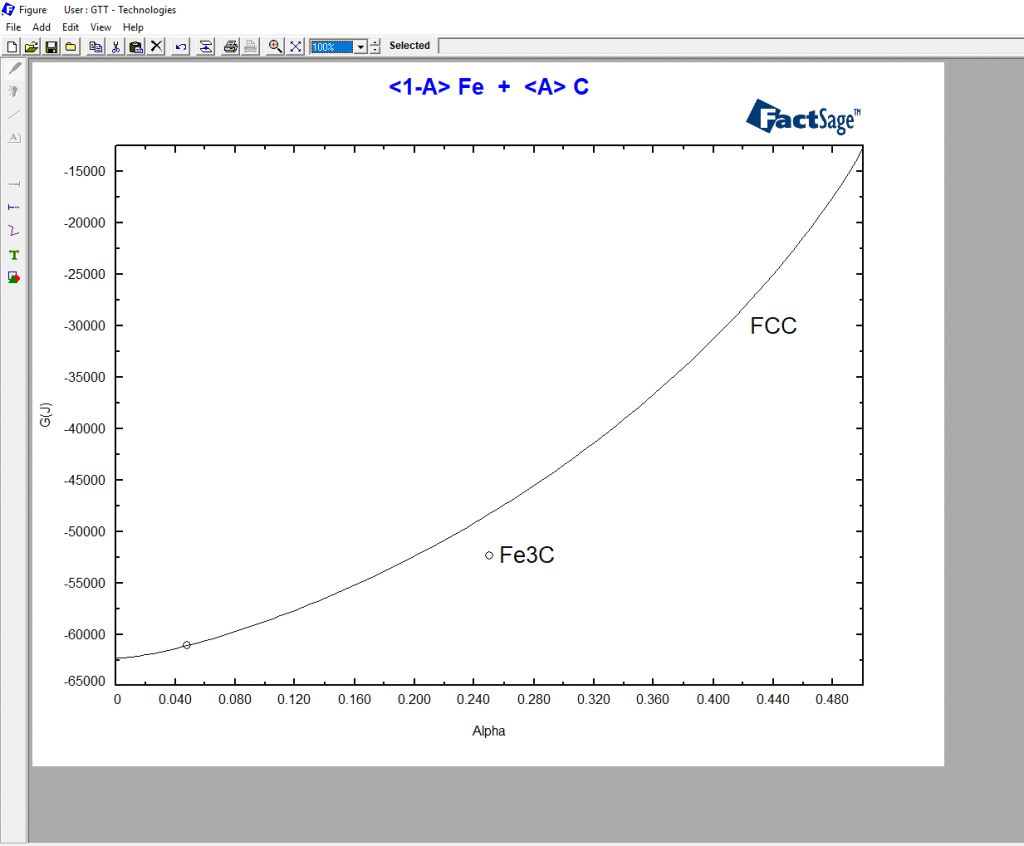
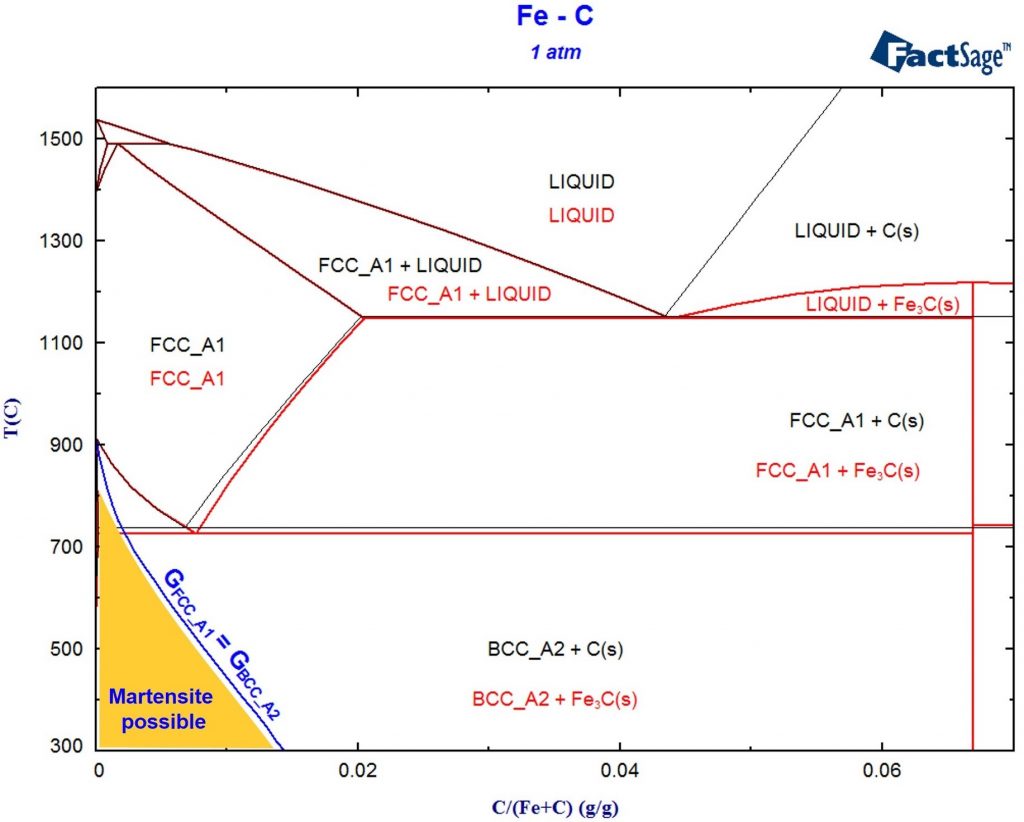
It is a common misconception that thermodynamic calculations can only be used for processes that are in equilibrium. In fact, there is a lot to learn from an Integrated Thermodynamic Databank System like FactSage even if you are far away from equilibrium! As example we consider the popular Fe-C system: If you choose all phases

Example for a FactSage calculation of a non-equilibrium process Read More »

A hands-on example for a phase-diagram-module calculation

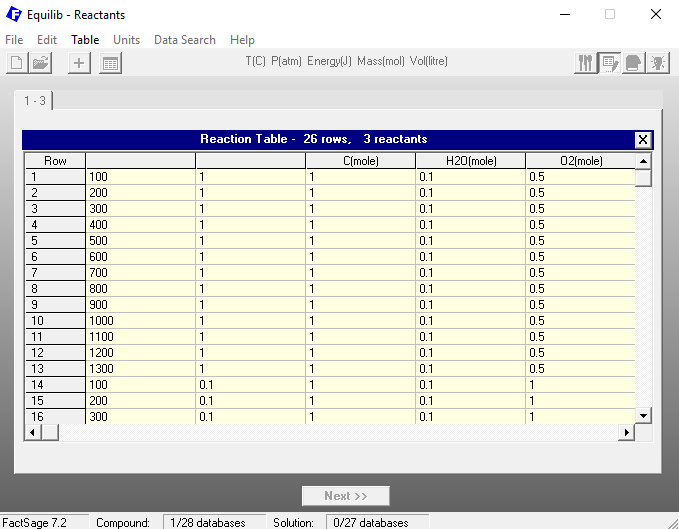
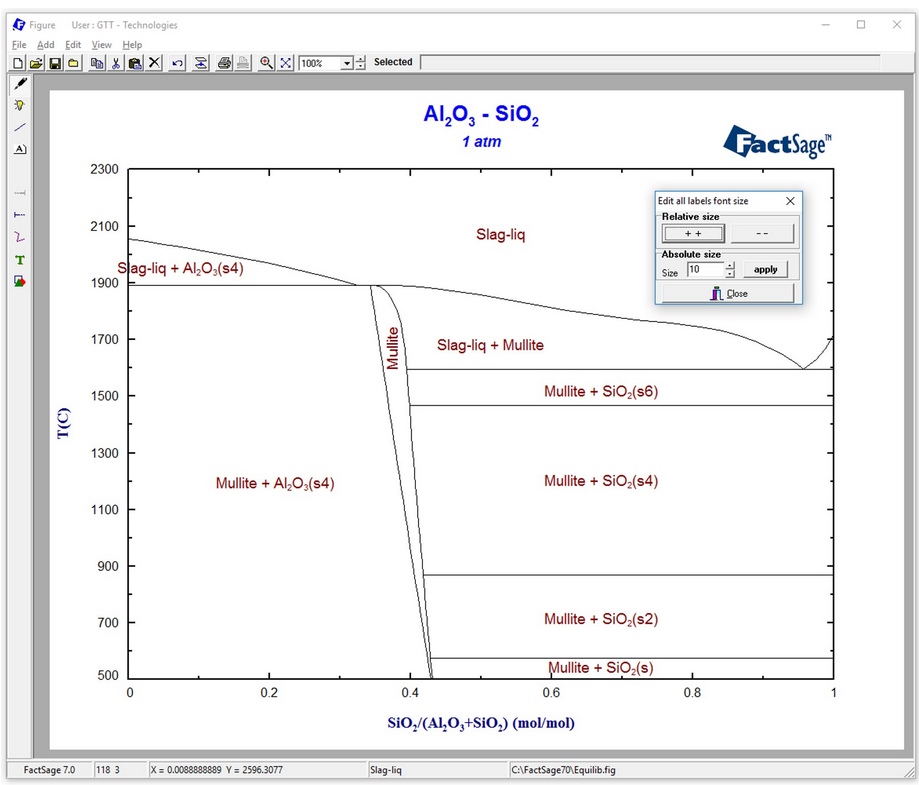
FactSage contains many modules. The major ones for daily work are Equilib and Phase Diagram. Phase Diagram permits the calculation of phase diagram sections for systems with any number of components. Components can be elements, compounds or even arbitrary compositions. For a phase diagram calculation, first the components of interest have to be defined. Then, the possible

A hands-on example for a phase-diagram-module calculation Read More »