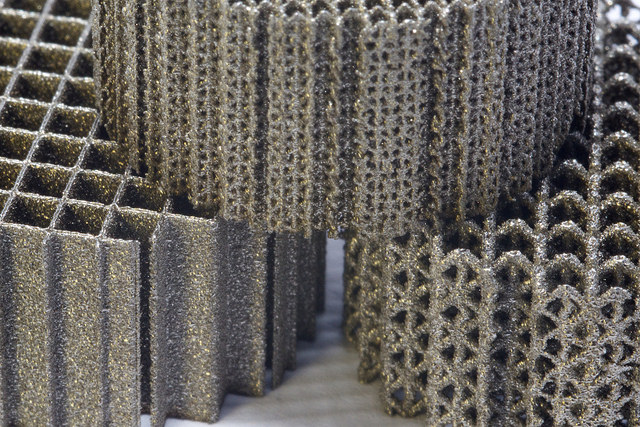
Additive manufacturing is definetely a “hot topic” these days. And it is not only hot because of the extreme temperatures needed for processes like Selective Laser Melting (SLM) of molybdenum alloys!
SLM of molybdenum alloys deserves attention because it combines a manufacturing process of the future with a material system that has the potential to replace state of the art Ni-base superalloys for high temperature applications because of superior mechanical properties [1]. In the recent volume of Acta Materialia, researchers at the Max-Planck-Institut for Iron Research (MPIE) Düsseldorf reported that SLM can help to strengthen a molybdenum alloy with Mo5Si3 rather than Mo3Si which would be the phase in equilibrium with BCC-Mo [2].
What is the mechanism that acts here – and could we predict phase formation for a new alloy before doing the experiment? I like examples that seem to contradict equilibrium thermochemistry since some people assume that CalPhaD-based tools like FactSage cannot contribute a lot here. The truth is quite the opposite! I want to demonstrate how FactSage can help understanding Solidification in SLM using the Spencer Group Refractory Metal Carbides, Borides, Nitrides, Silicides database SpMCBN.
It is helpful to start with a calculation of the liquidus surface using the phase diagram module. The researchers at MPIE worked with a Mo-12Si-8B alloy (in at.%). On my laptop it takes 8 seconds to obtain the following liquidus projection, showing what is the first solid phase precipating from the liquid:
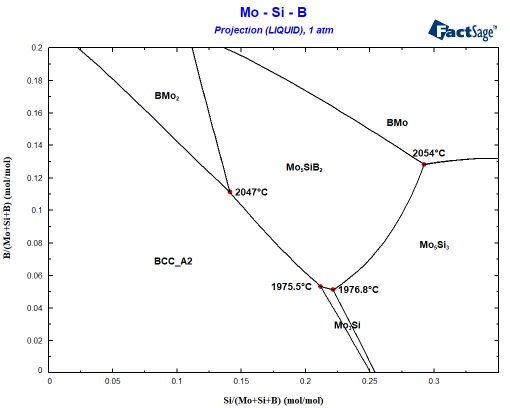
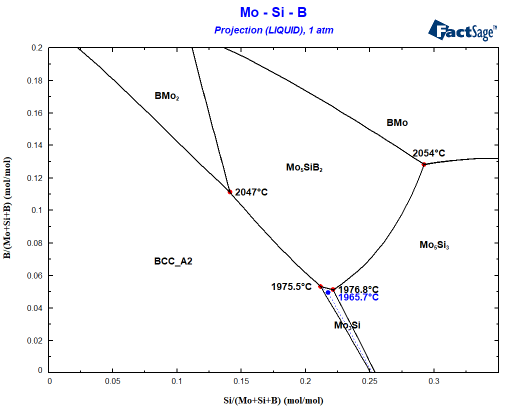
The starting composition can be found at x=0.12 and y=0.08. You can see easily that the Mo-12Si-8B alloy will first precipate the BCC phase. A Scheil cooling calculation using Equilib tells me that the alloy should then precipitate Mo5SiB2 since the liquid enriches in B and Si before finally the invariant point at 1975.5°C is reached where the remaining liquid decomposes to BCC+Mo5SiB2+Mo3Si. This is not what is seen experimentally! Why? The answer probably is somewhere between interface energies and kinetics: It can be seen that Mo3Si is part of the liquidus surface only in a narrow composition space! Let’s assume that Mo3Si does not form due to kinetic limitations. This is very simply done by omitting Mo3Si during the phase selection in the calculation! Small change, important effect as you can see in the following figure showing the difference to the first figure in blue:
It is obvious that Mo5Si3 is also nearly stable when Mo3Si should form. How close can be seen when you plot the composition of the liquid phase during Scheil cooling into the same diagram:
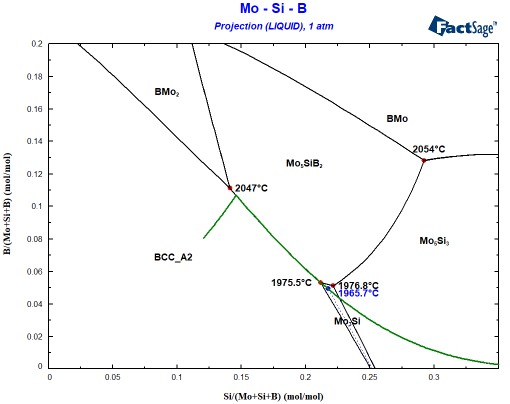
In this calculation, both Mo3Si and Mo5Si3 were set to dormant, i.e. the Gibbs energy minimizer will evaluate the stability of the phases but will not allow their formation. This is a very practical feature! We can see how the liquid composition develops during the Scheil cooling if only the BCC phase and Mo5SiB2 exist. More importantly, we can now plot the driving force for precipitation of both phases. The driving force is obtained from the calculated phase activity. The phase activity is related to the distance from the tangent describing the equilibrium. This is shown in the inset of the following figure. As can be seen, both Mo3Si and Mo5Si3 show a negative driving force for the precipitation above 1975°C.
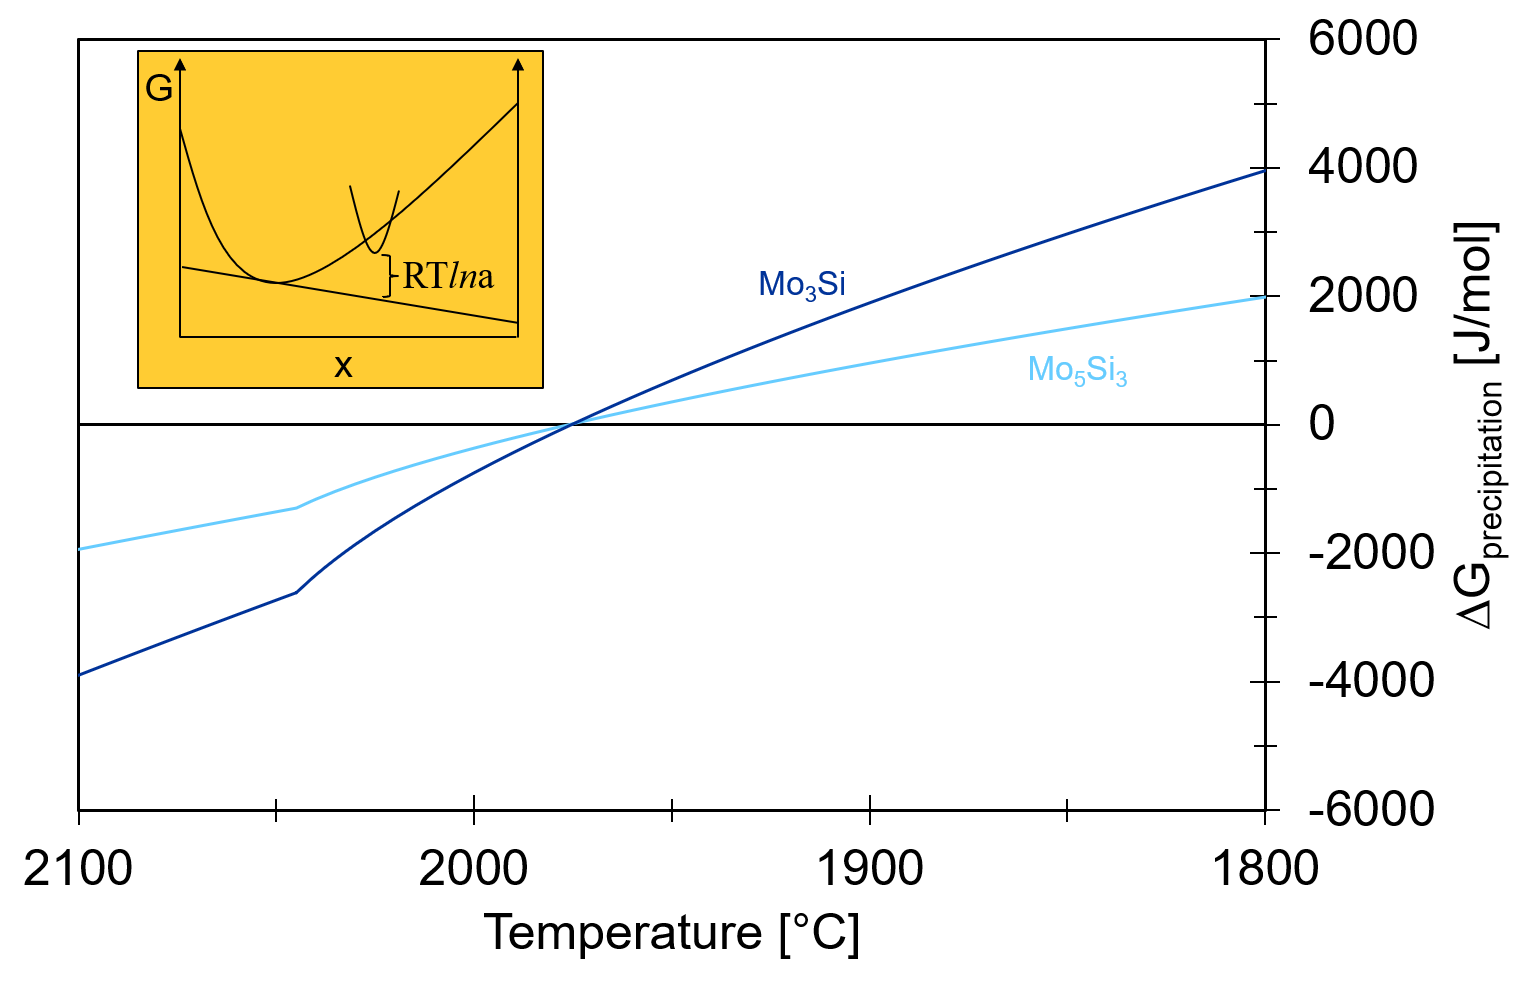
However, there is only a difference in temperature of first precipitation of 10°C between the two phases. With the extreme cooling rates in SLM, both phases are practically stable at the same time! Now surface energies and precipitation kinetics become important. The group at MPIE could identify a preferred orientationship between the BCC matrix and Mo5Si3 – so there is a high chance that this rather stable interface pushed the balance towards Mo5Si3!
I like this example how FactSage and the thermochemical databases can help navigating through chemical composition space to understand phase formation in a process that is normally assumed to be “far from equilibrium”! After all that is probably the most fundamental necessary condition for the deployment of a new material and a new process to application!
Do you have a comment, a question or another example where equilibrium thermodynamics helped understanding a non-equilibrium process? Please leave a comment!
References
[1] G. Liu, G.J. Zhang, F. Jiang, X.D. Ding, Y.J. Sun, J. Sun, E. Ma, Nature Mater. 12 (2013) 344.
[2] S.K. Makineni, A.R. Kini, E.A. Jägle, H. Springer, D. Raabe, B. Gault, Acta Mater. 151 (2018) 31.
Featured image of the blog post by Jonathan Harris: SLM Lattices I © Department of Engineering, University of Cambridge licensed under CC-BY. Link
Hello,
This is Elmira from Aurubis, Hamburg. Why can’t I see the figures of additive manufacturing example?
Kind Regards,
Elmira
Hello Elmira,
thank you for your remark!
We have re-included the figures in the blog post.
Kind regards,
Joao
Hello,
Are there examples of the slag solidification process?
Best regards,
Yannan
Hello Yannan Wang,
thank you very much for your comment.
There are many examples available on how to calculate slag solidification with FactSage. Please take for example a look on the link below:
https://factsage.com/FactSage_Applications/Workshop_Fe_Applications_I-2021.pdf
(starting from Slide 45)
Kind regards,
Joao Rezende