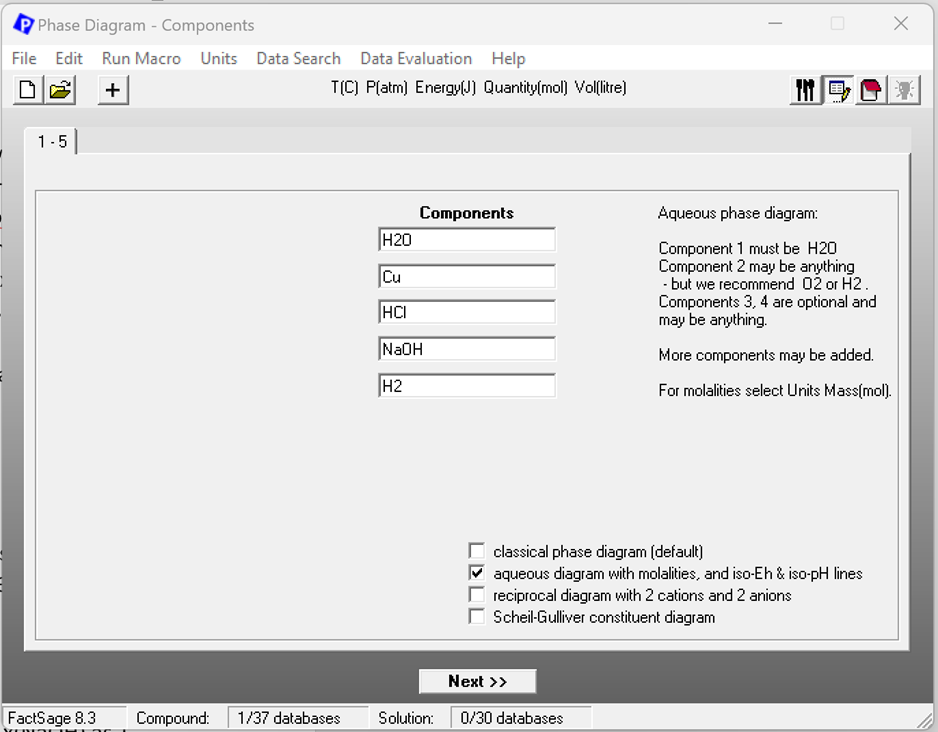
Now let’s see how the option “aqueous diagram with molalities and iso-Eh & iso-ph lines” works. Figure 6 shows the Components screen for this option. Note that the order of the components is the same as for the “classical phase diagram”.
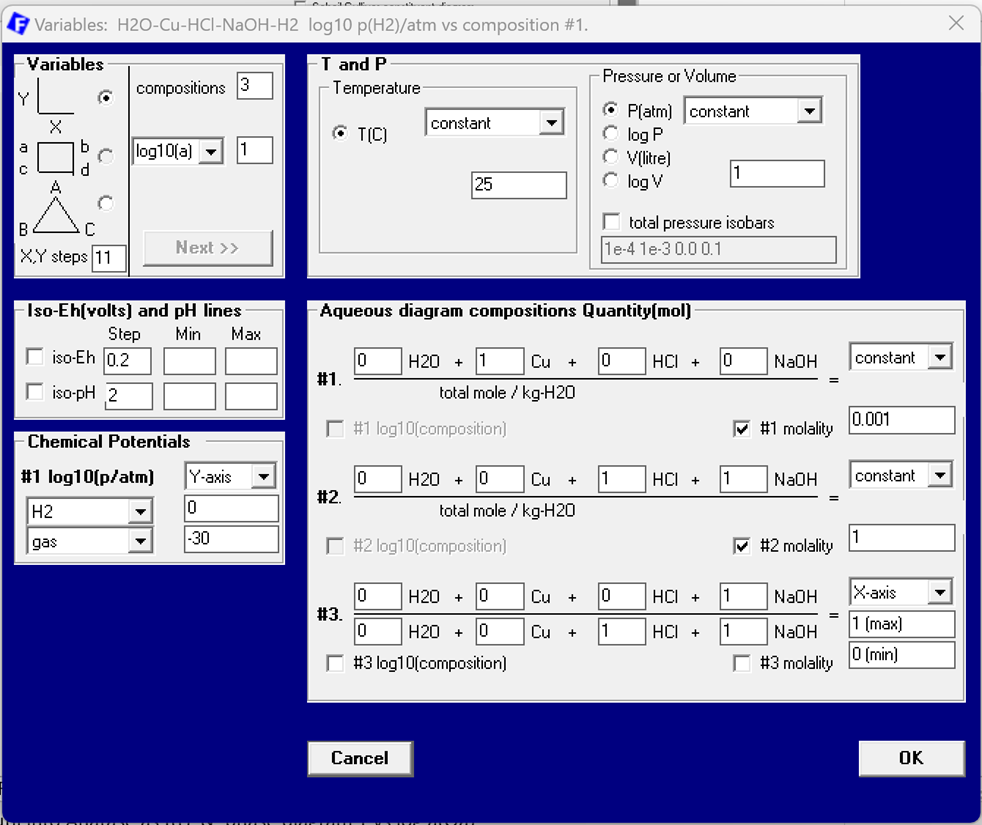
With the same choice of the phases as above we now obtain a different Variables screen which is shown in Fig. 7. The special set-up for aqueous systems now permits use of axis variables and constants which are directly related to units used for aqueous systems. This holds especially for the composition unit molality. In the present case molality is used for both the Cu constituent and the acid-base pair. The values are identical to those used in the classical set-up: molality of Cu is 0.001 and molality of the acid-base pair is 1. Note that it is nevertheless still possible to use the classical molefraction for the relative amount of NaOH vs HCl+NaOH. This is used as the x-axis of the diagram while the y-axis is the partial pressure of H2. Thus the resulting diagram is identical to the one in Fig. 5 above.
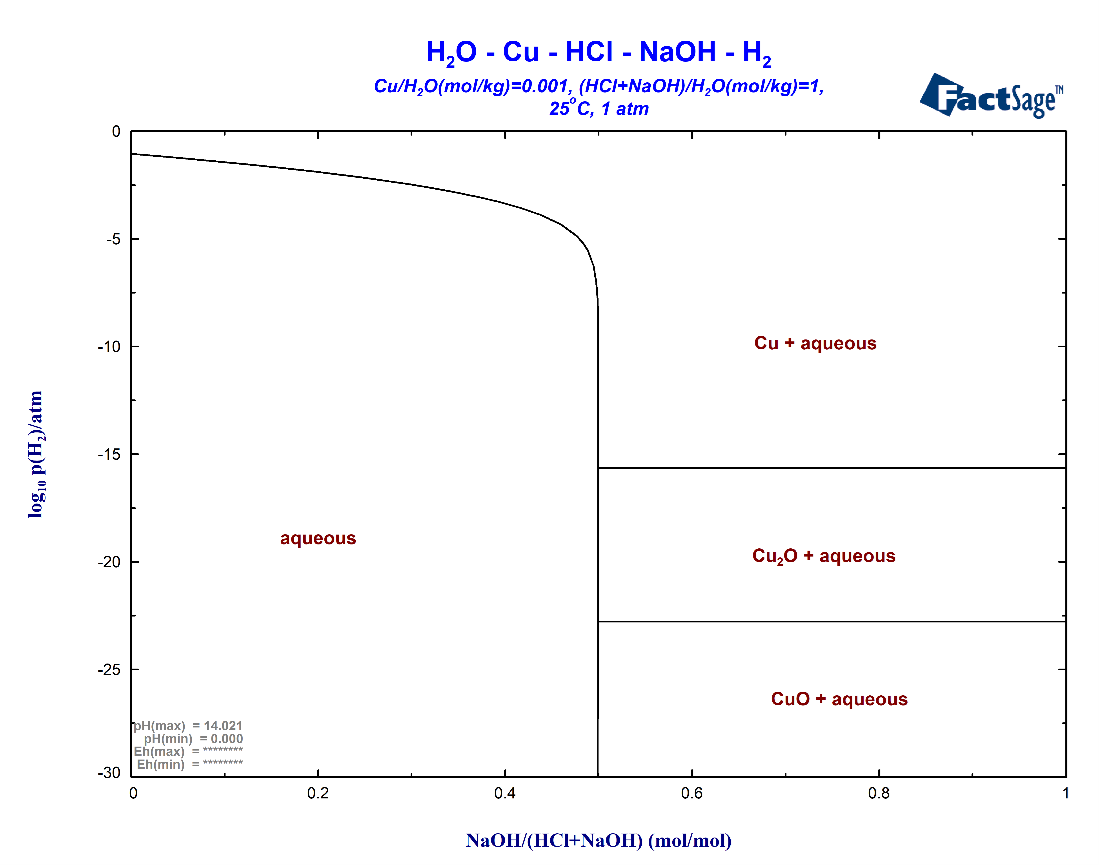
NOTE the difference in the figure header
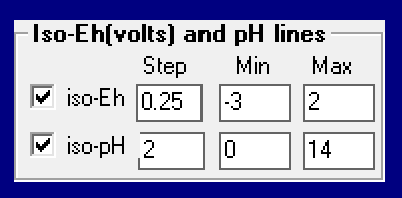
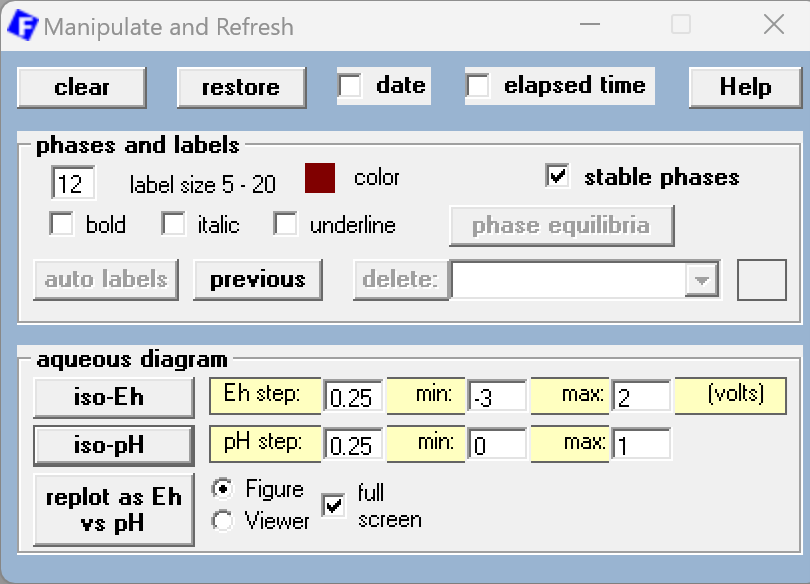
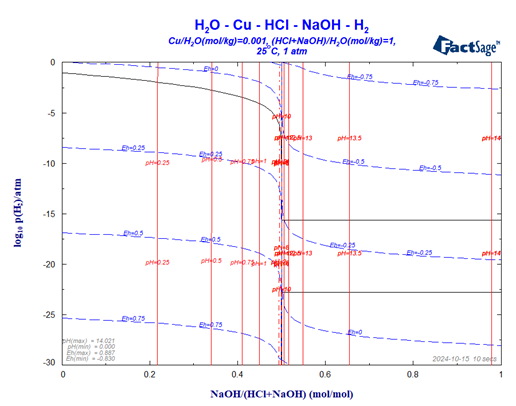
One very useful option indicated in Fig. 7 is the option to combine information on the Eh- as well as the pH-values relating to the different phase regions. For both variables it is possible to insert iso-lines into the diagram. Fig. 9 shows the two sets of iso-lines: -3 < iso-EH < 2 (step 0.25) and 0 < iso-ph < 14 (step 2). It should be noted that the user has the option to add such lines also when in the Figure screen of the phase diagram module. Especially for the iso-pH lines this is very useful since equal step-size between the lines is not very useful because of the sharp change of the pH value when the molefraction of the base component passes 0.5 (see Fig. 11).
Note: This window is available in the Figure module while the calculated diagram is ready for editing.
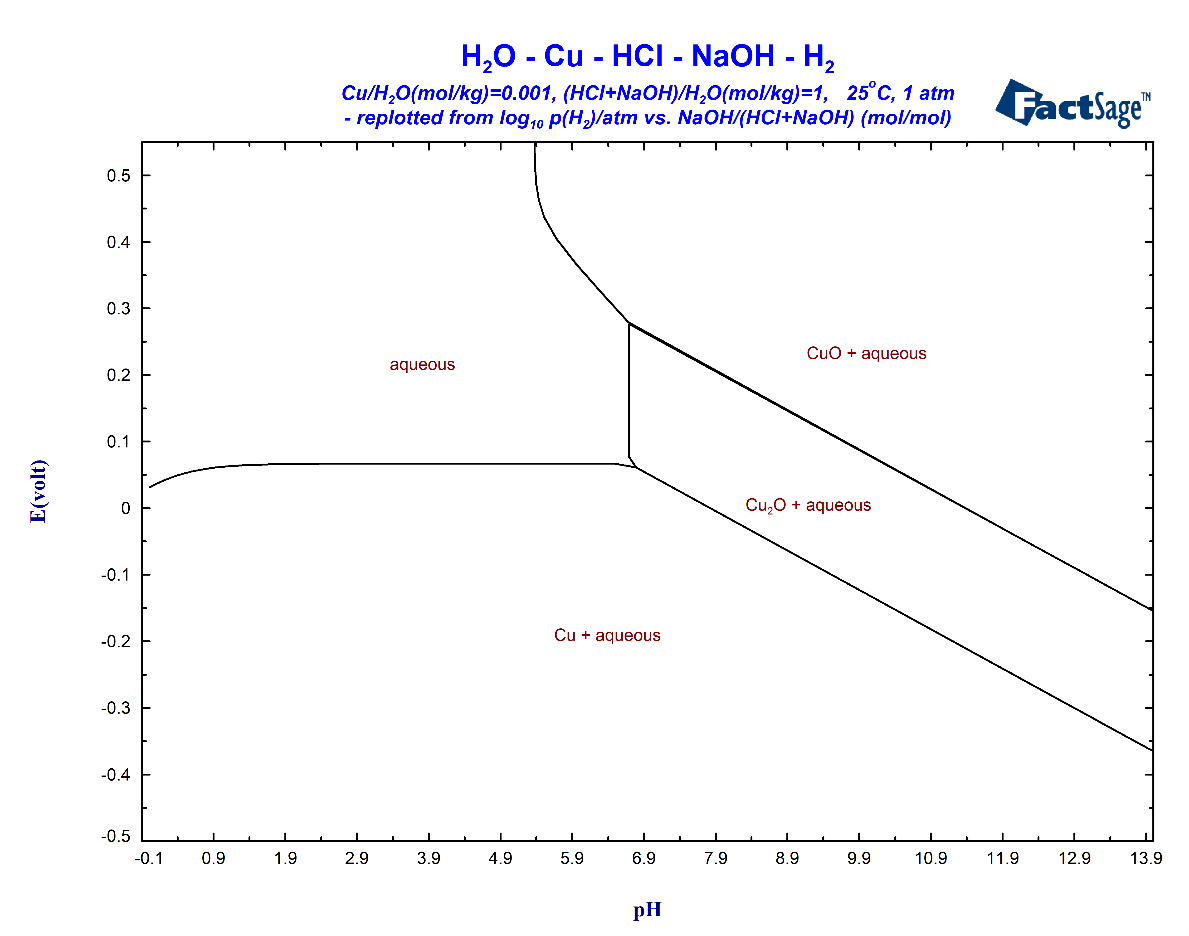
An additional feature of the Phase Diagram module concerning diagrams for aqueous systems is also indicated in Fig. 10. If the set-up of the x- and y-axis permits the conversion to pH and Eh then the Manipulate and Refresh screen enables the user to replot the diagram with the classical axes of a Pourbaix diagram, i.e. Eh vs pH. All that is needed is pressing the “replot as Eh vs pH” button. The resulting diagram for the present case is shown in Fig. 12. Note the big difference to Fig. 1 with respect to the phase boundaries surrounding the single phase region of the aqueous phase. It should also be noted that this type of diagram usually needs some editing by the user in order to obtain a proper appearance.
For further reading on the topic of true aqueous phase diagrams the following reference is recommended: Pelton, A.D., Eriksson G., Hack K., Bale C.W.; 2018, Monatsh. Chem., 149, 395-409
This post is Part 2 of a two-part series on Aqueous Phase Diagrams by Klaus Hack. Read Part 1 here:

