It is customary to discuss the phase formation in systems with an aqueous phase on the basis of a so-called Pourbaix diagrams. These represent at constant temperature, usually 25°C, the regions of precipitation respectively solubility of a metallic component respectively its oxides or hydroxides for a particular molality as a function of Eh, the potential of the H+ electrode (H[+](aq) + e[-] = ½ H2(g) ), and pH, the acidity/basicity of the aqueous phase. An example for Cu (molality=0.001) is given in Figure 1.
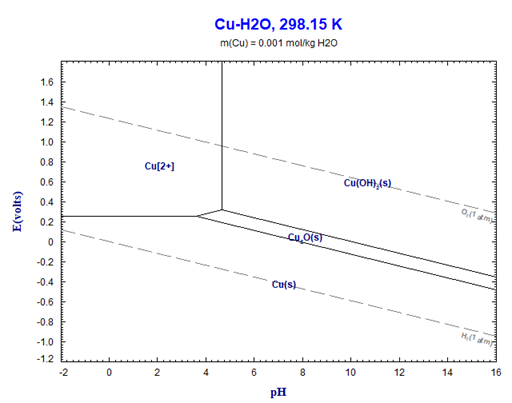
For a general overview this type of diagram certainly serves its purpose, however: (1) it is not a true phase diagram (note for example the range denoted by Cu[2+]. This is not the area of a stable phase, but simply denots the predominant species in the aqueous phase) and (2) it does not take into account which additional chemical species (acid and/or base) are used in order the establish the acidity/basicity, i.e. the pH-value. This can lead to strong misinterpretations, as will be shown below.
It was suggested by Hack (K. Hack Editor, The SGTE Casebook – Thermodynamics at work, 2nd Edition, 2008, Woodhead Publishing in Materials, pp 58-65) to replace the Eh-axis by a log P(H2) axis (because of the electrode reaction: H[+](aq) + e[-] = ½ H2(g)) and the pH-axis by a molefraction axis related to an acid base pair, e.g. HCl/NaOH. Note that this choice enters two explicit new chemical components, Cl and Na, into the system Cu-H-O which are not contained in a Pourbaix diagram. In reality these do, however, play an important part since nobody can simply add H+ respectively OH- into a system to fix the pH value. It is always necessary to use a real acid respectively base. Since we now are going to generate a true phase diagram including the aqueous solution as one of the possible phases the Phase Diagram module of FactSage needs to used. At first we use the option the “classical phase diagram” option. This will show that an “aqeous phase diagram” is in fact a classical phase diagram, but with a very particular choice of the axes variables and constants.
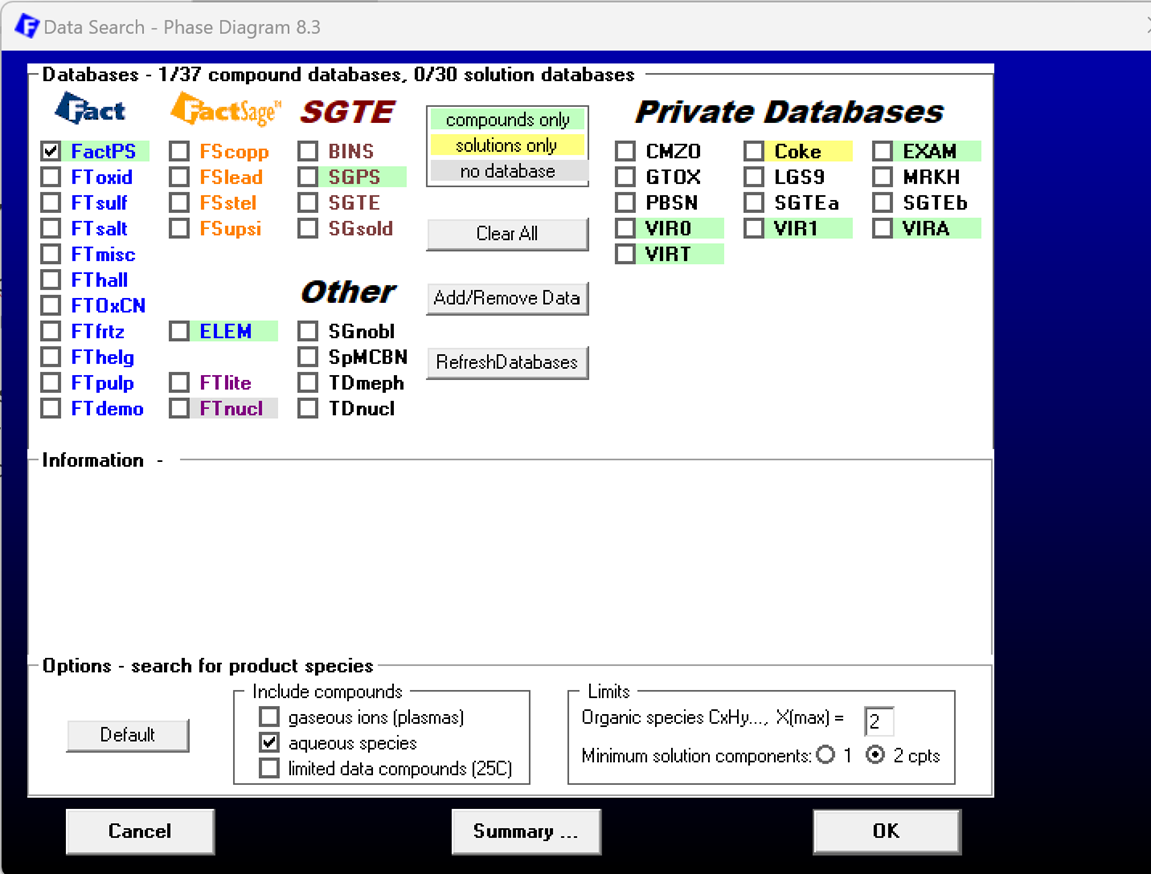
For the input in the phase diagram module we now use Cu-H2O-HCl-NaOH-H2 as the chemical species. However, first we need to select a database which contains aqueous data. FactPS is such a database. NOTE-1: The selection of the aqueous species has to be set explicitly in the Data Search screen as indicated in Figure 2. NOTE-2: FTHelg is also a database suitable for aqueous applications.
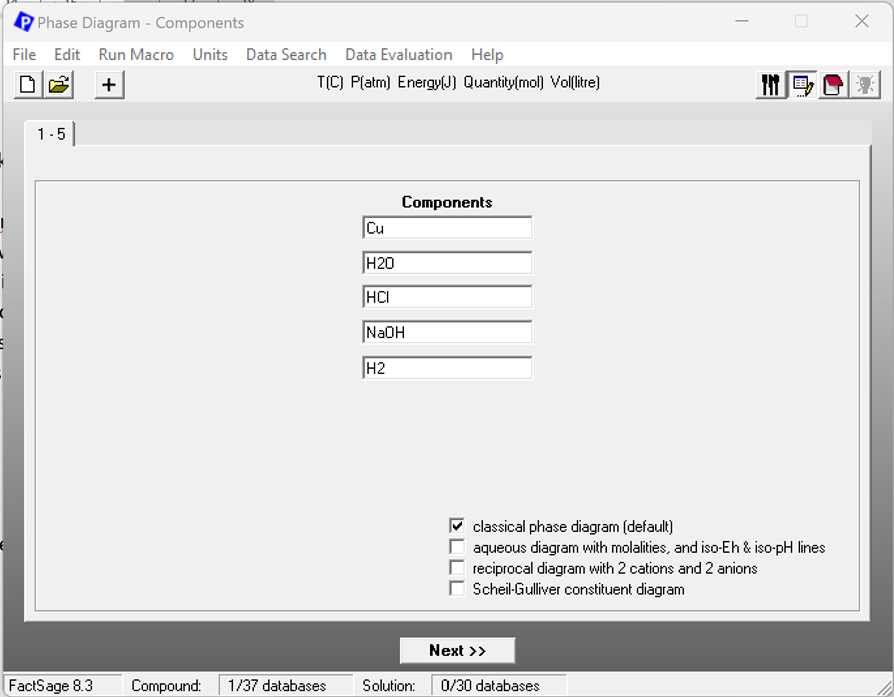
Once the correct database is chosen it is possible to enter the components that are used for the actual phase diagram. Figure 3 shows the components screen of the Phase Diagram module for this case. Note that the choice of species and their order has already some influence on the settings for the axes variables (see Fig. 4). The choice of the phases and species is the usual. Therefore, a screenshot of the Menu screen is not given here.
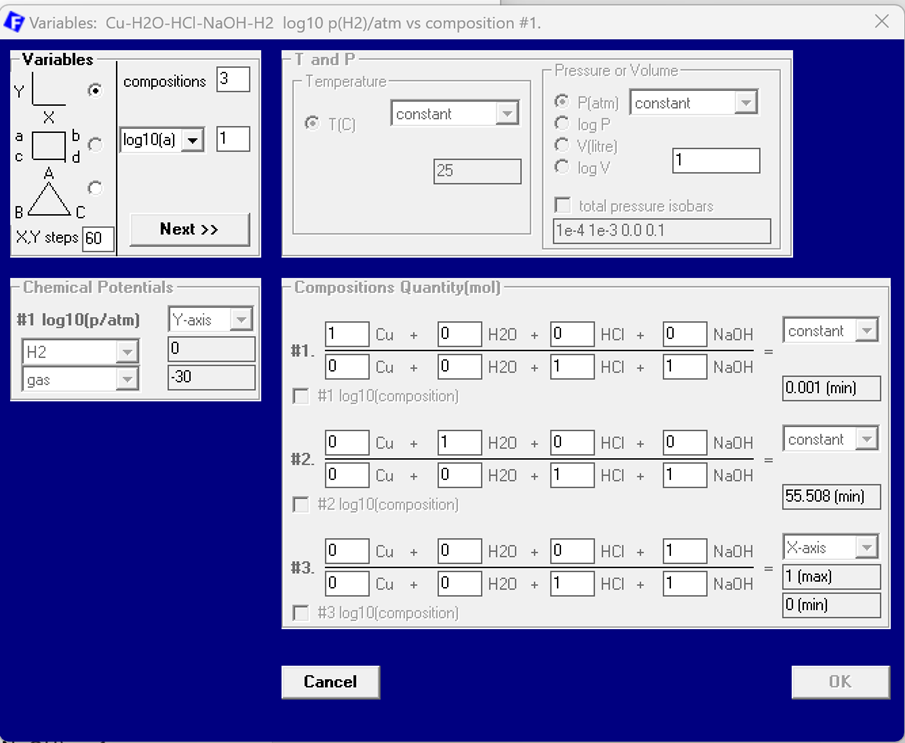
After selecting all Aqueous Species and all solid phases the Variables screen can be used in order to define the x- and y- axes variables. x is the molefraction of the basic component NaOH, i.e. x(NaOH) as 1 NaOH / (1 HCl + 1 NaOH), and y is the partial pressure of H2, i.e. p(H2). Furthermore several constant parameters need to be set: T = 25 °C, ptotal = 1 atm. In addition the ratio of water versus the acid-base pair is supposed to express the combined molality of HCl+NaCl. Since molality is mole per one kg of water the formula expressed in moles only is: n(H2O)/(n(HCl)+n(NaOH))= 55.508 (mol/mol) [= 1kg/1mol]. Finally, the ratio of Cu versus the molar amount of the acid-base pair is set: n(Cu)/(n(HCl+NaOH)=0.001 mol/mol. The former leads implicitly to amount variable of Cu in the calculation also to be molalities. The latter sets the molality of Cu to be 0.001. The molality of the acid/base pair is 1. See Figure 4.
The resulting phase diagram is given in Figure 5. It is obvious that, just like in the Pourbaix diagram, there are boundary lines which separate the solid precipitates Cu, Cu2O and Cu(OH)2 from the region in which only the aqueous phase exists. However, the single phase region of the aqueous phase is not top left but bottom left in the diagram and the sequence of the Cu-containing phases is upside down. That is caused by the invers dependence of the Eh-value with respect to the H2-partial pressure. The upper x-axis in this diagram is identical to the lower dashed line in the Pourbaix-diagram (Fig. 1) which stands for a hydrogen partial pressure of 1.
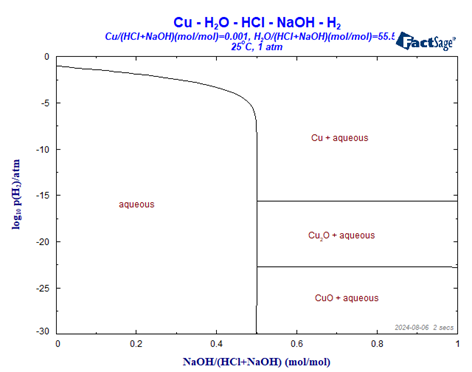
The diagram shows one single phase region as well as three two phase regions. The single phase region (bottom left) shows the stability range in which copper at a total molality of 0.001 is completely dissolved in the aqueous phase. Both, the molefraction of NaOH, i.e. the pH value, and the partial pressure of H2 can be varied over a wide range without precipitation to occur. However, if the molefraction of NaOH (vs HCl+NaOH) passes 0.5, the precipitation of metallic copper, Cu, or one of the two copper oxides occurs. The decisive parameter now is the partial pressure of H2. Note that the order of the precipitates is invers to the order in the Pourbaix diagram. That is related to the reaction H[+](aq) + e[-] = ½ H2(g)) with K= p(H2)1/2/a(H+)*a(e[-]). See later for a phase diagram which shows the same order of the precipitates as the Pourbaix diagram.
This post is Part 1 of a two-part series on Aqueous Phase Diagrams by Klaus Hack. Read Part 2 here:

