A customer has asked me: “Is it possible to export/import data to and from FactSage? For instance, I would like to do a series of calculations for different initial chemical compositions of the system and it would be very useful to import all the compositions automatically from an Excel table into FactSage”.
Yes, it is possible and it is indeed quite easy. In this blog post we will show how to import data from Excel into FactSage and to perform automated calculations with FactSage.
We will work with the Equilib module. In the reactants window we enter for example with the following:
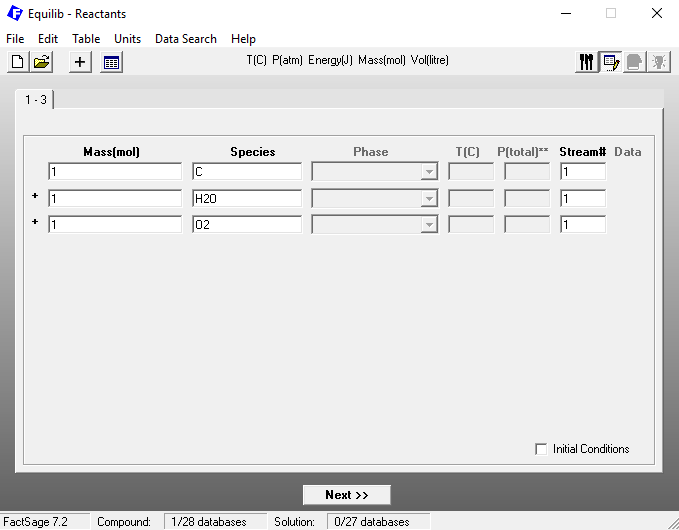
Figure 1
Let us suppose we had already created an Excel table like the one below, which we exported from Excel as a .txt file.
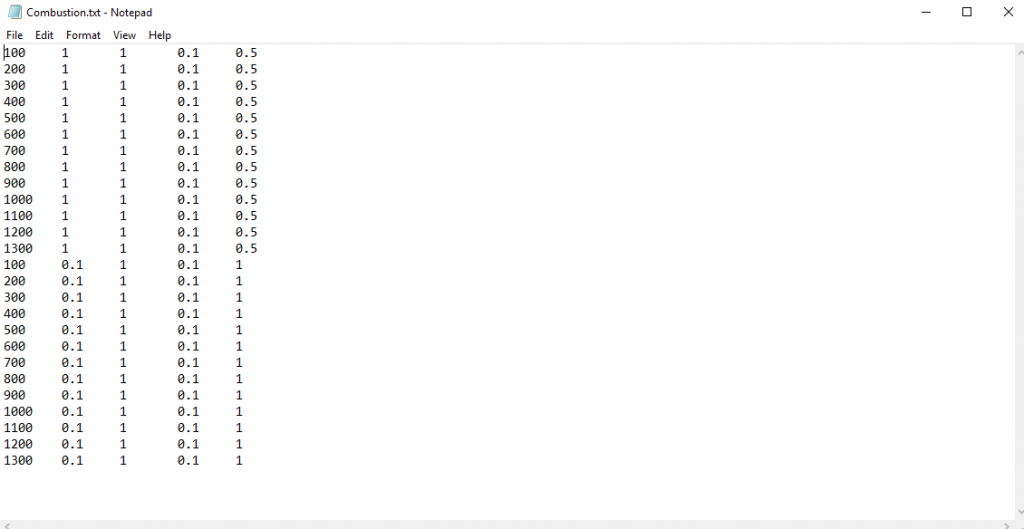
Figure 2
In this table, the first column corresponds to the simulation temperature in °C, the second column to the pressure in atm. The last three columns correspond to the carbon, oxygen and water amounts in mol. Since we have 26 rows, we have 26 different simulations. Notice that we can fill in the columns in any way we want, that is to say, the order of the rows can be as arbitrary as you like, provided the tabular format is respected.
On the last FactSage screen of Figure 1 you click on the Menu bar at “Table”->”Reactants Table”.
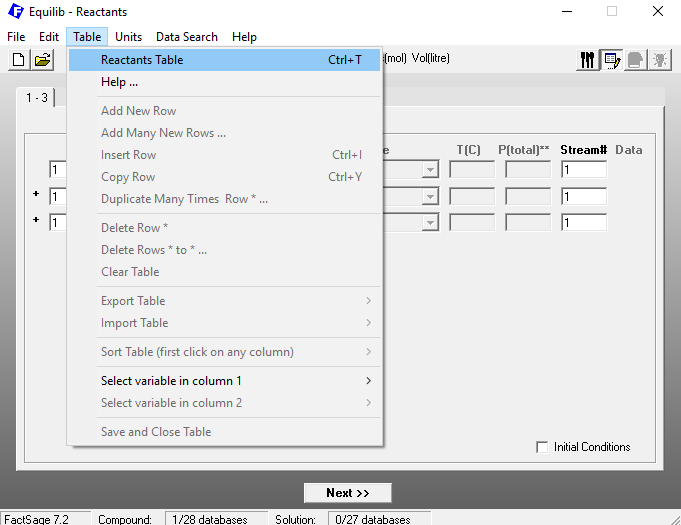
Figure 3
When the input table shows up, click on the Menu bar at “Table”->”Import Table”->”from simple text file without headers” and choose the table file to be imported into FactSage.
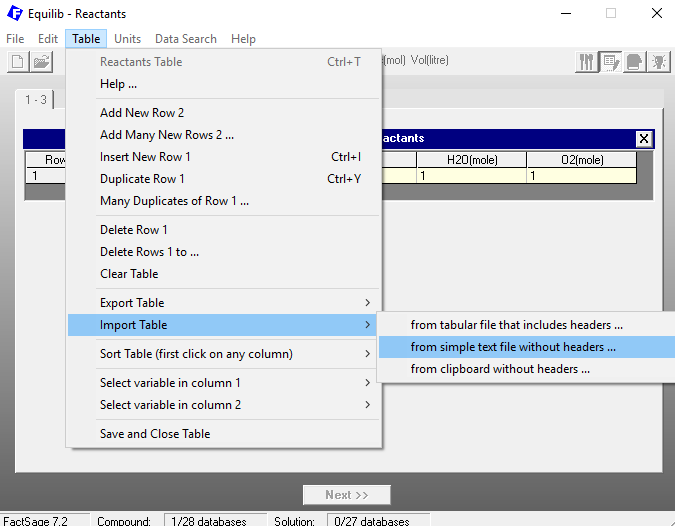
Figure 4
The next figure shows the imported table already in FactSage:
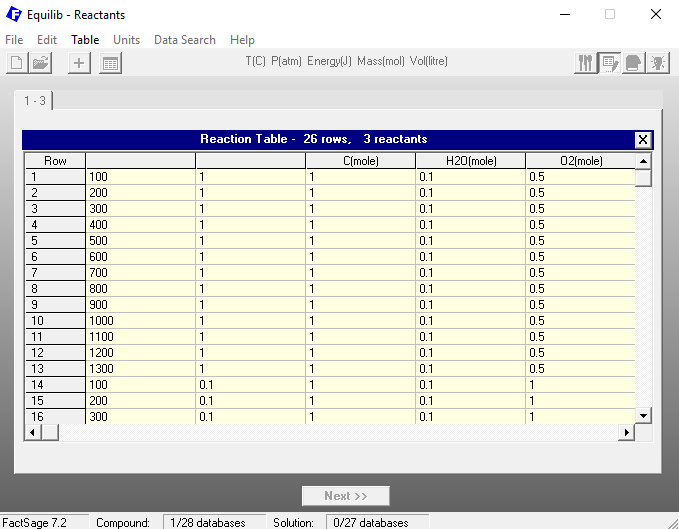
Figure 5
As next you click on “Table”->”Save and Close Table”.
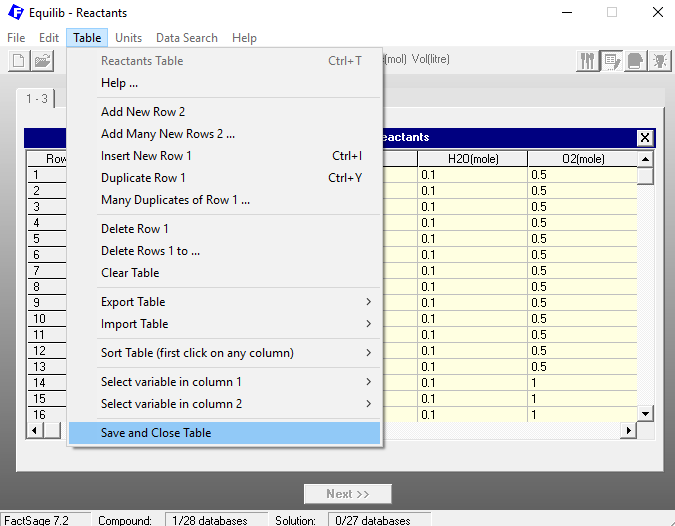
Figure 6
You will then come back to the reactants window below. Click on “Next”.
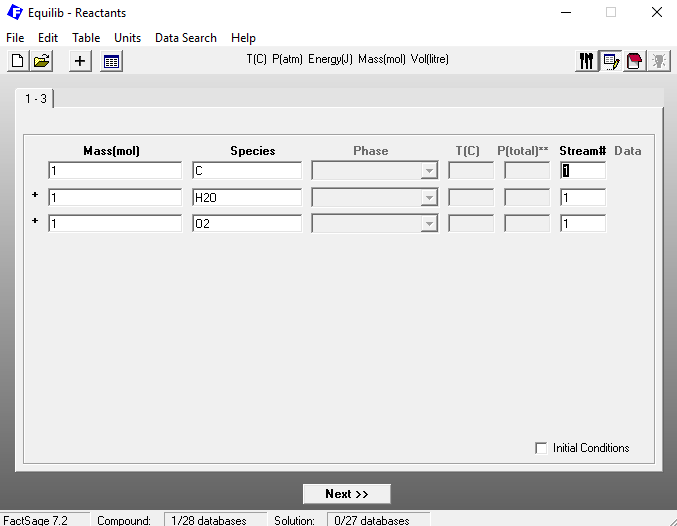
Figure 7
On the following screen, I clicked on “gas”, “pure liquids” and “pure solids” as the possible products to form. As you can see, the combo box “Table” in the bottom of the window is already checked. This is necessary to ensure the calculations load the conditions from the table.
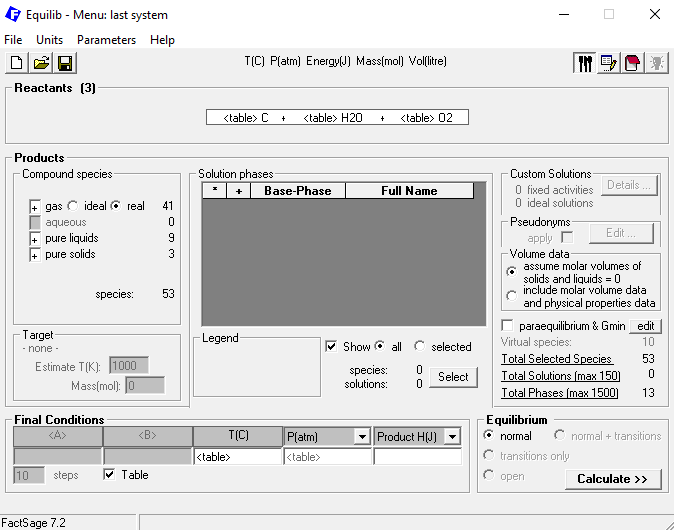
Figure 8
And then finally, we click on “Calculate”. On the next figure, you can see the results. Each results tab numbered from 1 to 25 corresponds to a line of the initial table.
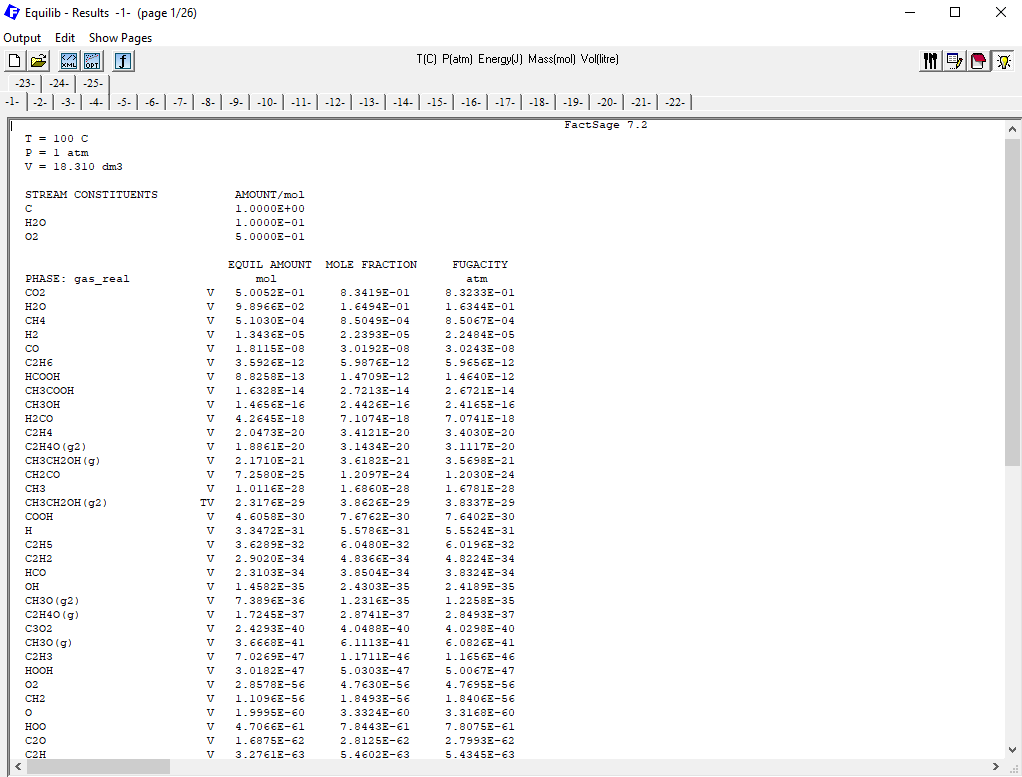
Figure 9
So we performed 26 different simulations as wished. And that´s all for this time! The next time, we will see how to export the calculation back to Excel again… see you!